Privacy Notice: This website uses analytics and marketing cookies to understand reader behavior and improve content. By continuing to browse or engage with this site, you consent to our use of cookies. See our Privacy Policy for details.
Today’s Drill Bits & Bytes focuses on 2012 oil drilling activity in Western Canada, giving a snapshot of industry activity relative to historical trends. All the analyses presented were generated using VERDAZO and data from the IHS Information Hub.
Oil Drilling on the Decline
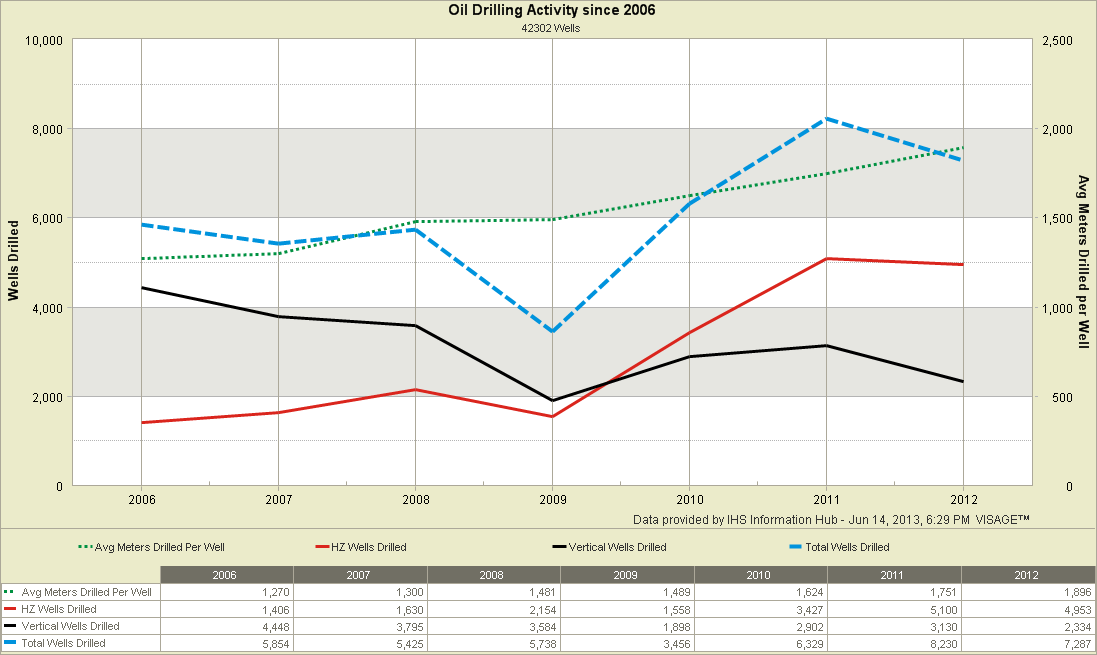
Drilling in Western Canada appears to be on a bit of a decline after peaking in 2011, with a decrease of 11% in 2012. Historically, the number of oil wells drilled annually has averaged around 6,000 since 2006. The low occurred in 2009 (3,456 oil wells drilled) with profound increases of 83% in 2010 and 30% in 2011 to a peak of 8,230 oil wells drilled in 2011. This 2011 peak was then followed by a decrease of 11% in 2012 (7,282 oil wells drilled).
Also of note, horizontal well drilling continues to strengthen. 2010 was the first year that horizontal well drilling exceed vertical. In 2012 there were more than two times more horizontal wells drilled than vertical.
Facts About Trends in Oil Well Depth and Length
Over the last six years, oil wells (excluding heavy oil wells) had an average TVD (True Vertical Depth) of 1,289 m with minor variations year over year. 2009 had the highest average of 1,346m and 2012 came in just slightly above the past six-year average of 1,307 m.
Horizontal well length for oil wells (excluding heavy oil wells) has had a similar rate of increase as gas wells, with an increase from 855 m to 1230 m over the last six years (an increase of 375 m).
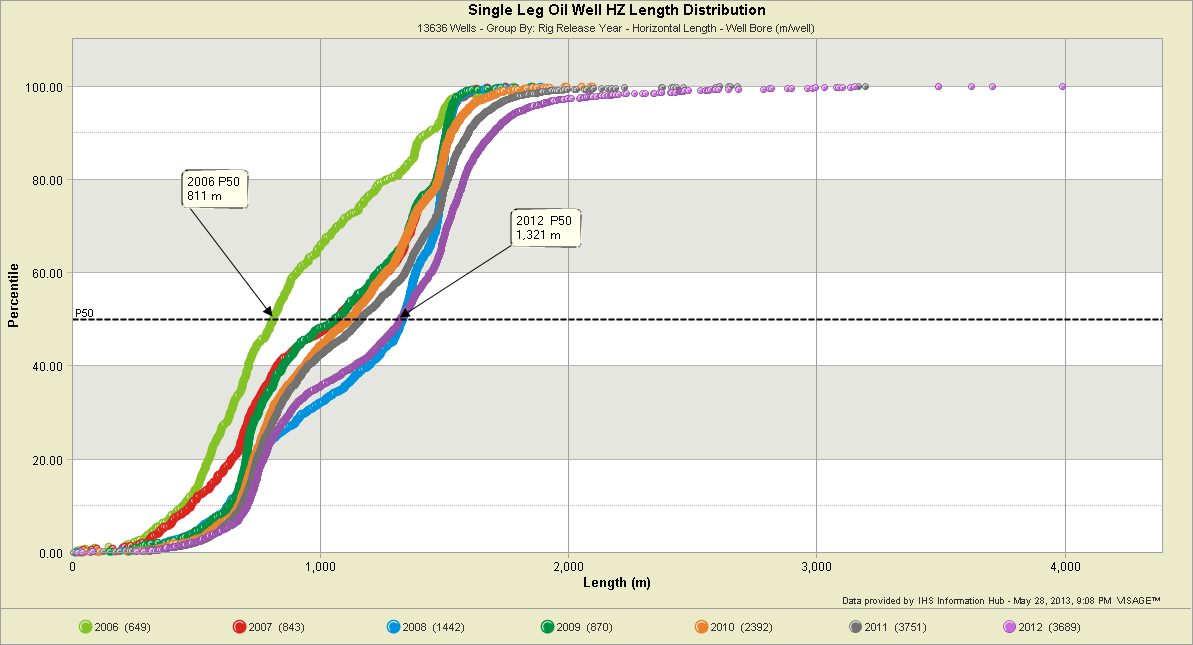
An interesting way to look at the evolution of horizontal well lengths is in a cumulative probability distribution, or percentile chart. This chart shows a distribution of the horizontal lengths drilled in each year since 2006. It demonstrates the variability of horizontal lengths in each year (by the shape of the distribution) and how the data trends over time (by the relative position of each distribution). I’ve highlighted the P50 values for 2006 and 2012. The largest step change took place in 2008, and 2012 is showing the longest wells yet.
Who’s Dominating Oil Drilling?
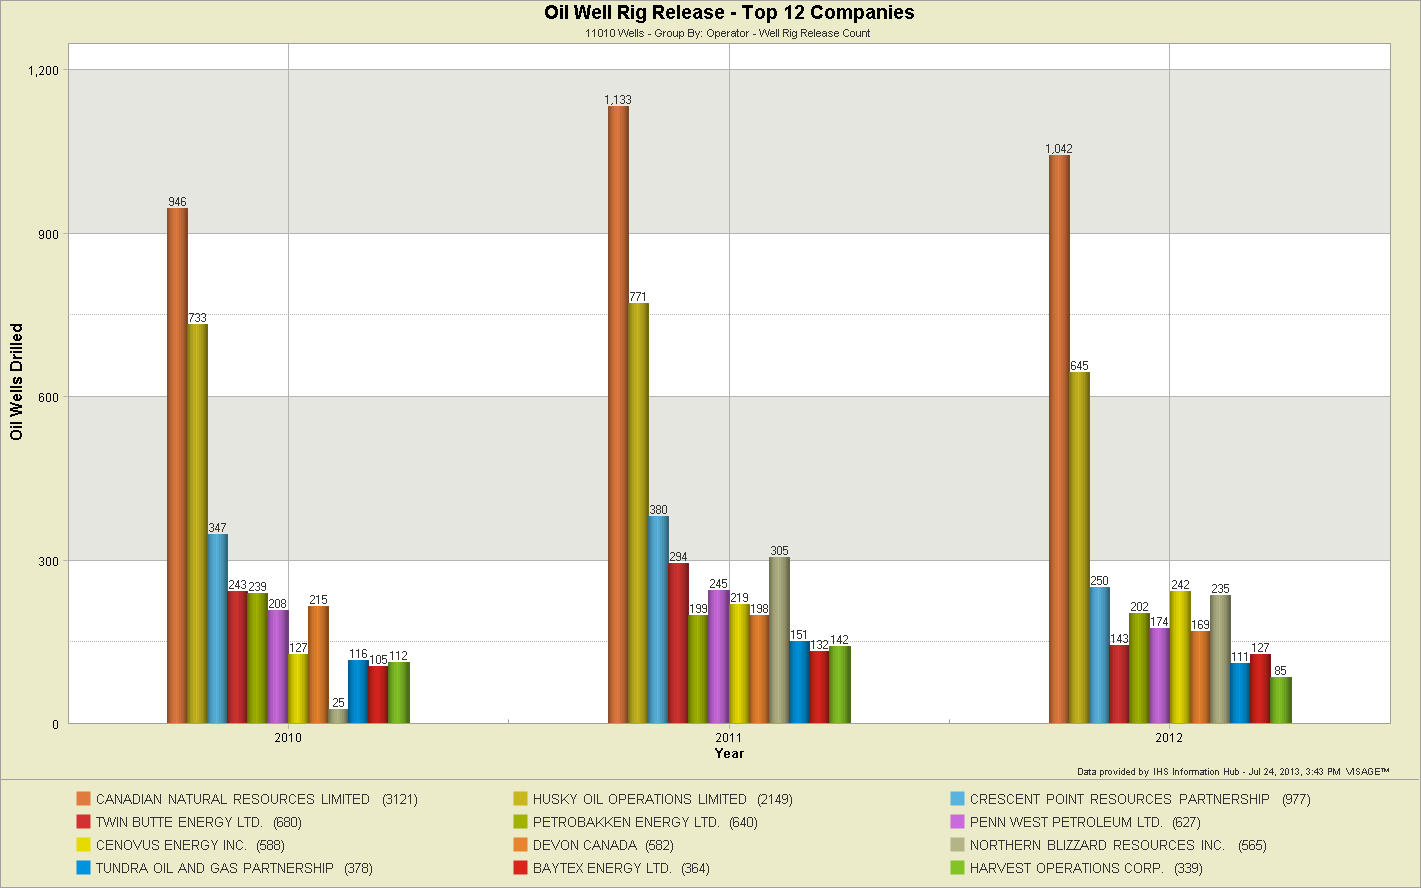
The top 12 companies (out of 434 companies) collectively made up 48% of all oil wells drilled in 2012. Drilling patterns are consistent for all of them, showing an increase in 2011 and a decrease in 2012.
What Oil Plays are being Drilled?
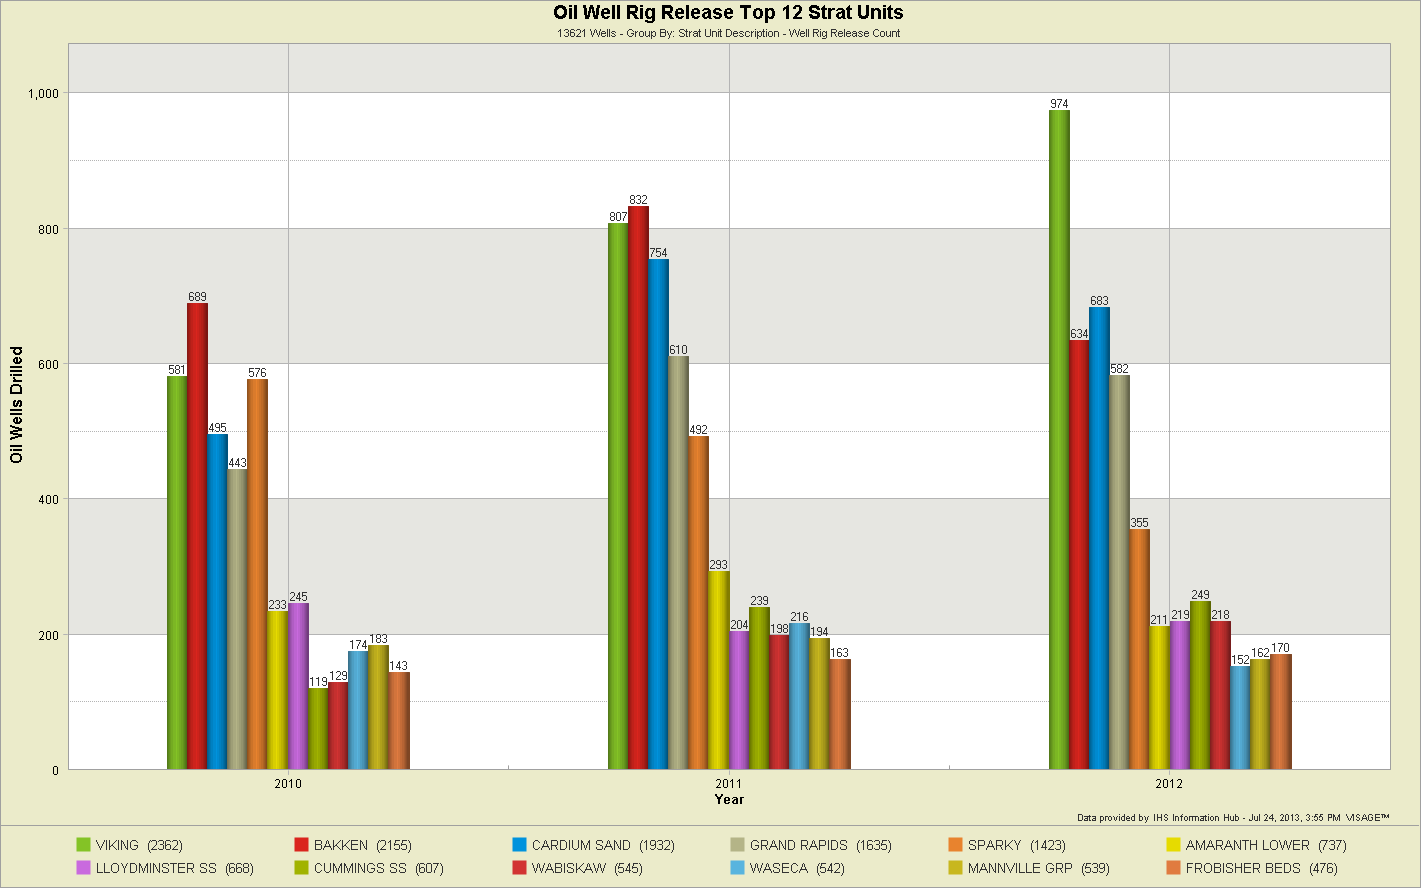
The top 12 stratigraphic units (out of 144 stratigraphic units that had oil wells drilled in them) made up 63% of all oil wells drilled. The 3 most notable changes include:
- Consistent growth in the Viking play (29% in 2011 and 20% in 2012)
- 24% drop in the Bakken drilling activity in 2012
- 28% drop in Sparky drilling activity in 2012
Thanks for reading. I welcome your questions and suggestions for future blogs.
