Privacy Notice: This website uses analytics and marketing cookies to understand reader behavior and improve content. By continuing to browse or engage with this site, you consent to our use of cookies. See our Privacy Policy for details.
Editor’s Note: With VERDAZO proudly joining Omnira Software in 2022, this blog is being re-published on the Omnira Software website.
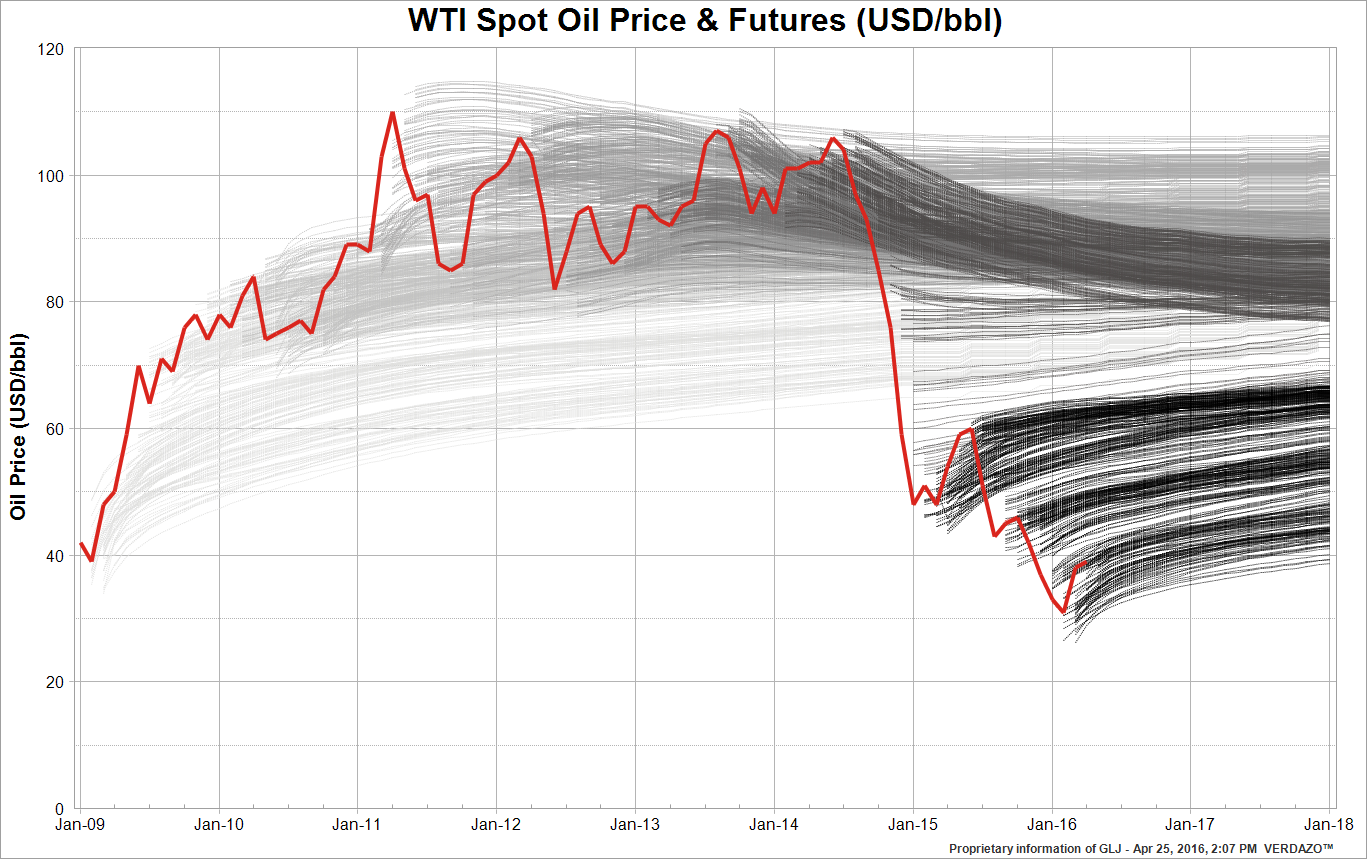
In building a price forecast, any single indicator, including forward curves, is usually a poor predictor of future spot prices. It is important to consider a wide variety of information when building a spot price forecast. In general, all price forecasts are wrong – the goal is to be less wrong more often and have a body of supporting information to justify each forecast. In the oil and gas industry, one of the primary uses of price forecasts is to provide a reasonable basis for the valuation of oil and gas assets.
These were insights I gleaned from a conversation with Tyler Schlosser, Director of Commodities Research, GLJ Petroleum Consultants. I asked Tyler about the cautions and considerations he takes when looking at Forward Curves in the process of building the GLJ price forecast. Here is what Tyler had to say:
“Oil and gas futures, or forward curves, are not true spot price forecasts. In addition to market expectations of future spot prices, other factors influence futures prices. Some of these factors are:
- interest rates
- inflation expectations
- storage costs and availability
- insurance
- hedging effects
- liquidity – can the contracts be easily bought and sold at sufficient volumes?
- rapid speculative position accumulation or unwinding (e.g., sudden widespread short-covering)
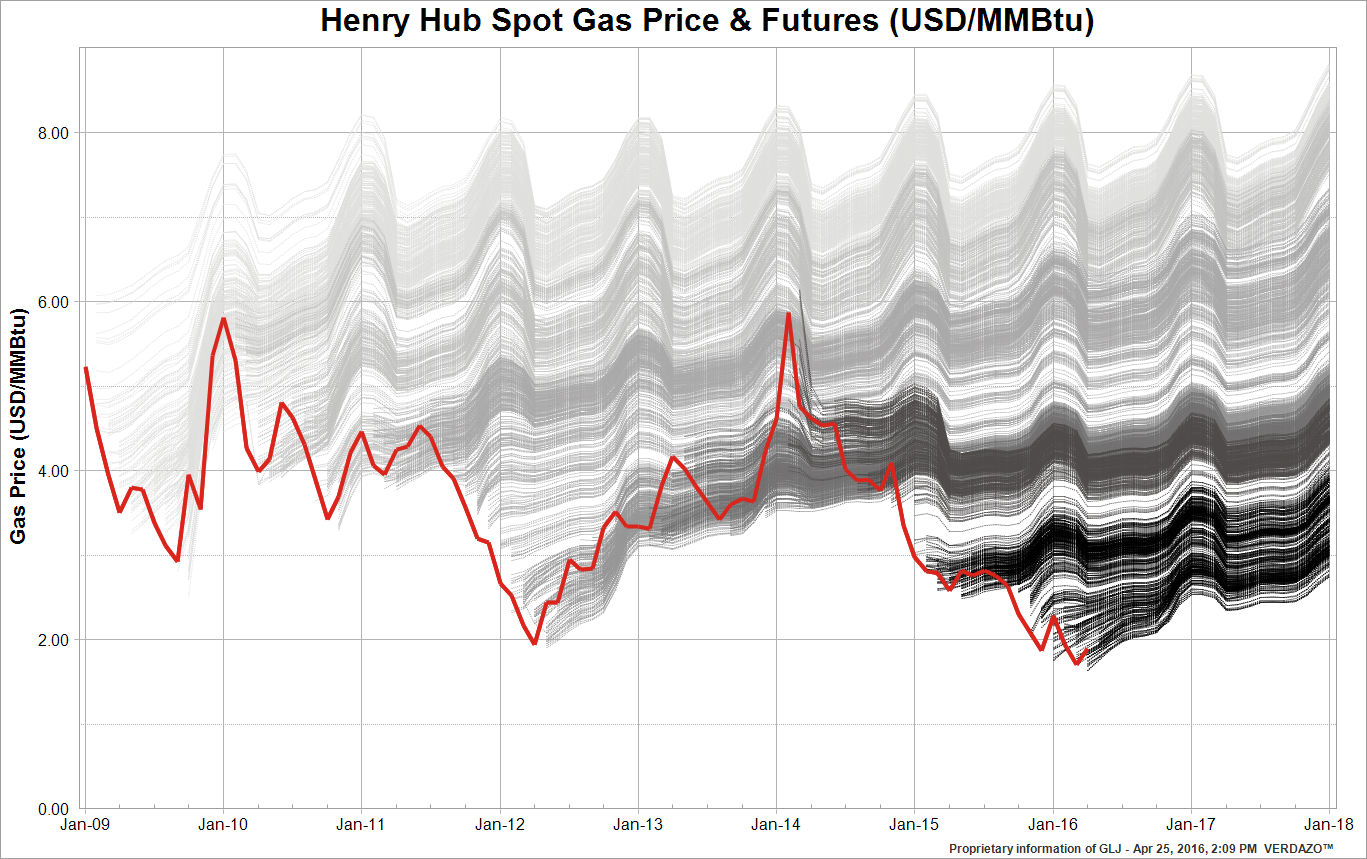
About the charts in this blog
The charts in this blog show the average monthly spot price (the red line) and the futures, or forward curves (in shades of grey through black). On a given transaction date (the forward curve generally starts a month or two after this), the forward curve provides the agreed-upon contract prices for future delivery dates. The monthly forward curves get darker in shade as the transaction date gets closer to the present (e.g. 2009 futures are light grey while 2016 futures are black).
Verdazo Analytics helps companies make smarter, faster decisions. VERDAZO software reveals the hidden insights into complex data through visual analysis tools, pre-built templates, custom reports and our dynamic discovery analytics workflows. Business users will be doing effective analysis on nearly any data source within minutes of getting set up. Verdazo Analytics: the leader in discovery analytics software for the Oil & Gas industry.
