Privacy Notice: This website uses analytics and marketing cookies to understand reader behavior and improve content. By continuing to browse or engage with this site, you consent to our use of cookies. See our Privacy Policy for details.
Editor’s Note: With VERDAZO proudly joining Omnira Software in 2022, this blog is being re-published on the Omnira Software website.
A production type curve is a representative production profile of a well for a specific play and/or area. That is, if you were going to drill a successful well in an area, a type curve would be the “best representation” of the expected production forecast. The type curve is (typically) established by calculating the average production rate of producing wells for each time period. You will never drill a well that behaves like the type curve, but it does give you a tangible representation of the likely outcome. Type curves are also very useful for comparing the “average production rates” of plays, companies, well types … something we will be doing in subsequent blogs. Here is an example of what you can look forward to:
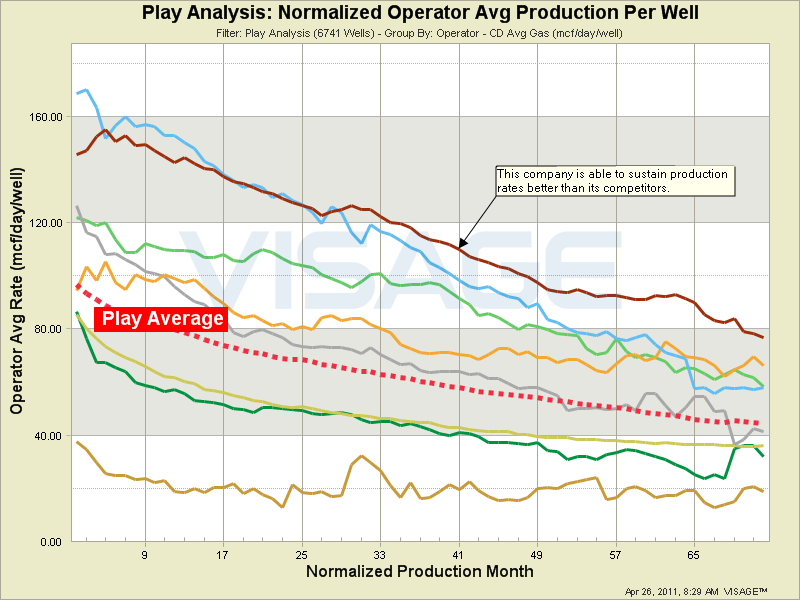
Normalized type curve analysis (rate vs time) provides a consistent comparison tool for production. Often used for well analysis (e.g. frac count, horizontal length, azimuth), normalized type curves are also valuable for comparing companies. This chart shows how several companies compare to one another and to the play average.
So What Is The Problem With Production Type Curves?
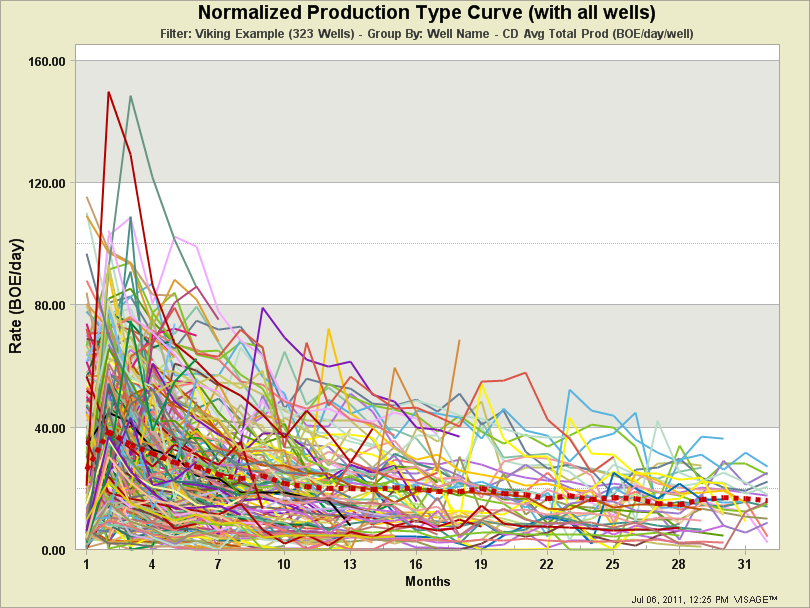
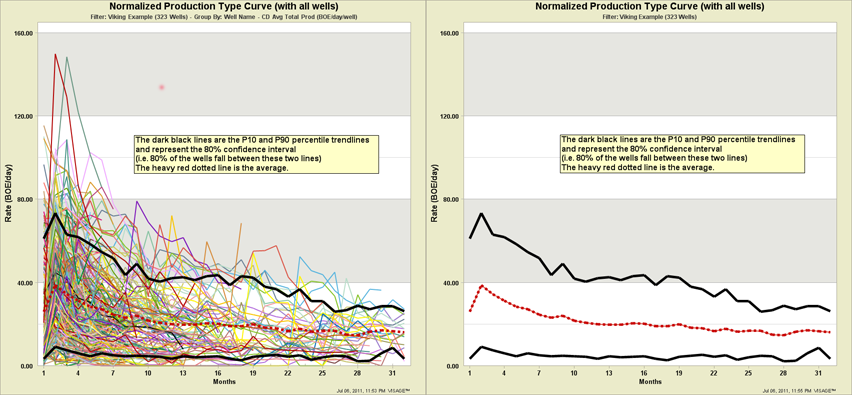
The problem with type curves is that the range of values used to calculate the average (type curve) are in no way represented in the type curve. I have a client who tries to understand the range of values that make up the type curve by showing all of the wells on one chart. As you can see, it does give you a sense of the range of values, but is a bit messy to look at. Maybe there is a better way to communicate and understand this?
Introducing Percentiles to Type Curves
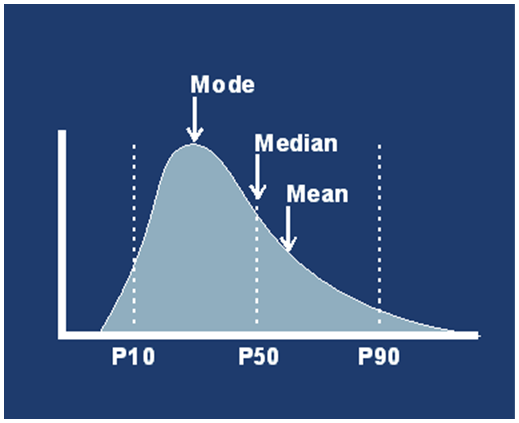
One technique that the industry uses to understand and quantify distributions of data is percentiles (or cumulative probabilities). This organizes the distribution into increments between 0 and 100. You can then take, for example, the 10th percentile or P10 number (I’m using a “less than” convention for percentiles in this example) and say 10 percent of my wells will have a value “less than or equal to” my P10 value. The location of percentiles on a typical lognormal distribution would look something like:
Percentile Trendlines
At VISAGE, we came up with an innovative visual analytics technique to address “the problem with type curves”. If we take the percentile concepts and apply them to production trends then we can assemble monthly percentile distributions together to create “percentile trendlines”.
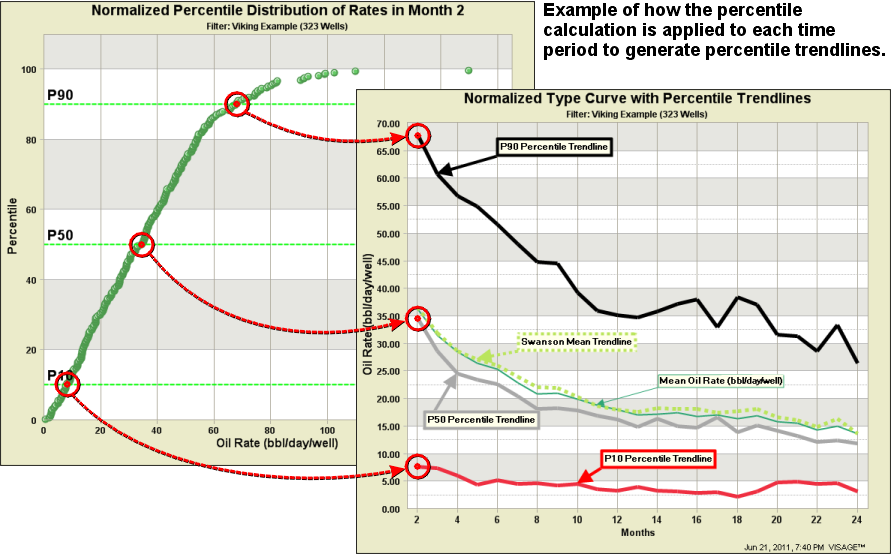
The result of these calculations for a percentile trendline look something like:
Hopefully, what I have shown you today has provided you with some insights into an innovative way to understand and communicate distributions of production data. We will be using this in some future blogs to help you understand the degree of variability that exists in some of the hotter plays today. Some plays you can expect to see include Viking, Montney, Cardium and Bakken.
