Privacy Notice: This website uses analytics and marketing cookies to understand reader behavior and improve content. By continuing to browse or engage with this site, you consent to our use of cookies. See our Privacy Policy for details.
Editor’s Note: With VERDAZO proudly joining Omnira Software in 2022, this blog is being re-published on the Omnira Software website.
Type Curves or type-well curves are a foundation of reserves evaluations, development planning, production performance comparisons and completion optimization analysis. The dangers of not understanding the complexities of Type Curves, and failing to communicate how they were designed/developed, can result in large statistical variability, inconsistent information used in development decisions, and unattainable economic plans (especially in the unforgiving times of low commodity prices). This blog series will focus on essential Type Curve considerations and analytic techniques that should be part of their development and use. The complete contents of this multi-week blog series will be presented at the upcoming SPE talk Understanding Type Curve Complexities & Analytic Techniques on Dec. 1st, 2015. Please join us.
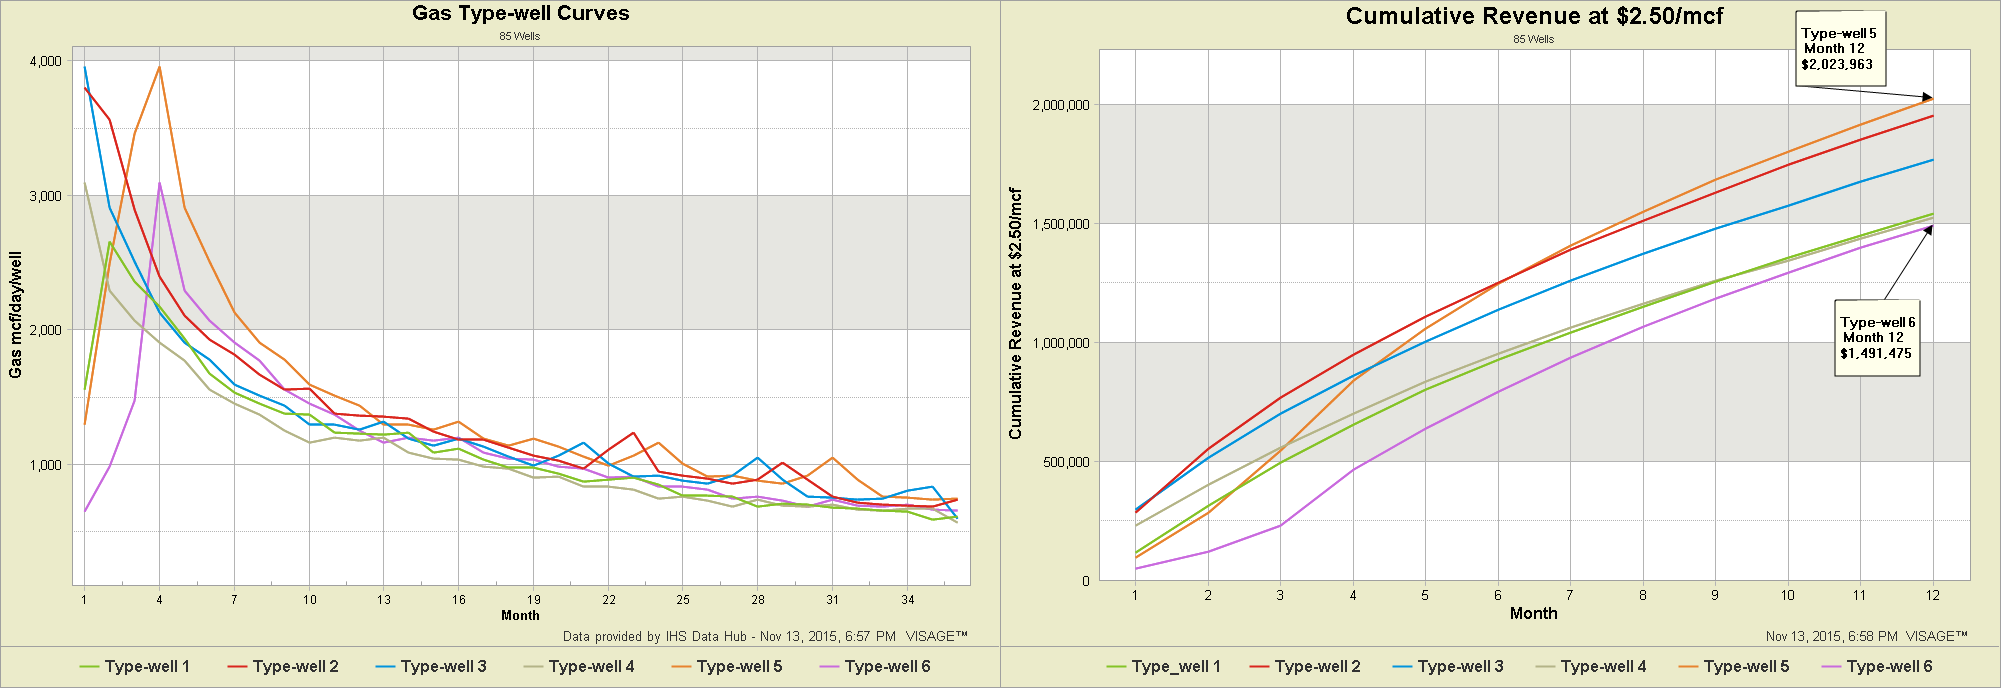
There are many ways to build Type Curves and they can yield significantly different results. In the example below, the left image shows six versions of a Type Curve for the same data set. The right image shows how different the cumulative revenues are for the first 12 months … showing a large enough difference to draw concern from any decision maker.
Type-well Curve vs Type Curve … What’s the difference?
While Type-well Curves are often referred to as “Type Curves”, they are different:
- Type Curves more properly refer to idealized production plots (based on equations and/or numerical simulation) to which actual well production results are compared.
- Type-Well Curves are based on actual well production data and represent an average production profile for a collection of wells for a specified duration.
When you’re making million dollar decisions on development plans and comparing options, you want to be sure that you understand how the Type-well Curve was created and what it is communicating. If this is not understood by your engineering team and decision makers then you could encounter issues such as:
- Results which create unrealistic or unattainable economic evaluations
- Large statistical variability in your Type-well Curves
- Gaming and inconsistency in the decision making process
Common Chart Types Used in Type-well Curve Analysis
There are several chart types used in Type-well Curve analysis. They are all based on the same production data, but each offers its own perspective on well production performance.
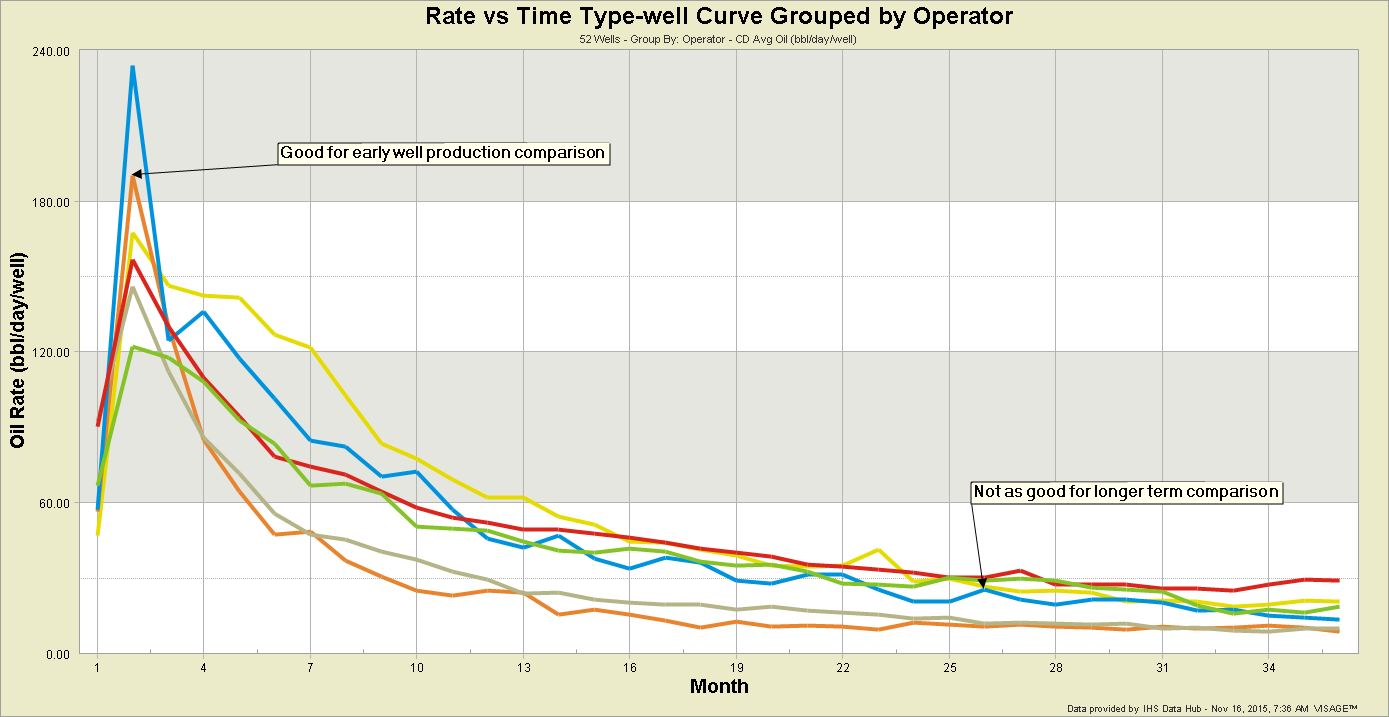
Rate vs Time: This chart type is useful for comparing early well production. The later months can be more difficult to compare because the lines often coalesce and differences are difficult to compare quickly.
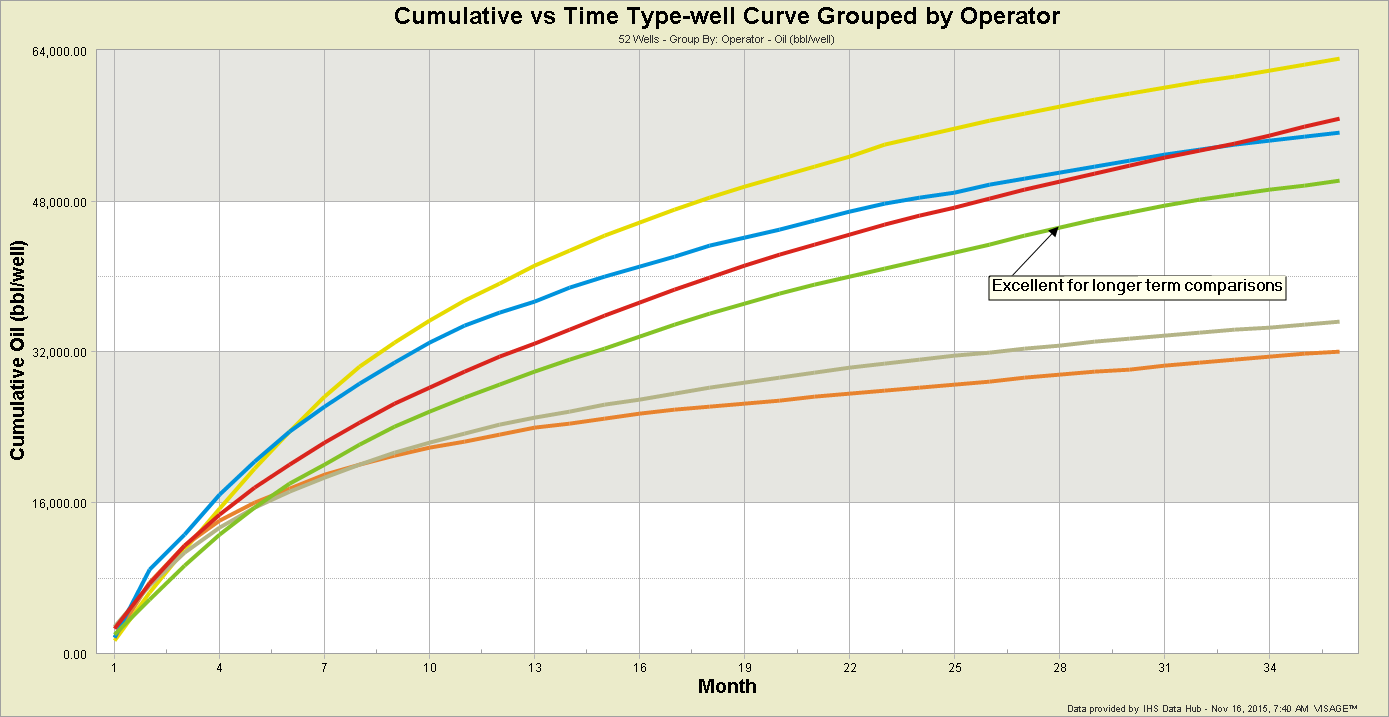
Cumulative Production vs Time: This chart type is useful when comparing the cumulative production at any moment in time, particularly several months after the beginning of a well’s life. It provides the quickest way to compare companies, technologies … beyond the first few months. It can also be an effective tool when considering payout as part of your analysis.
Rate vs Cumulative Production: This chart type is most commonly used by reservoir engineers. The curve provides a visual trajectory of the Estimated Ultimate Recoverable (EUR), but does not effectively communicate the time it takes to achieve a level of cumulative production.
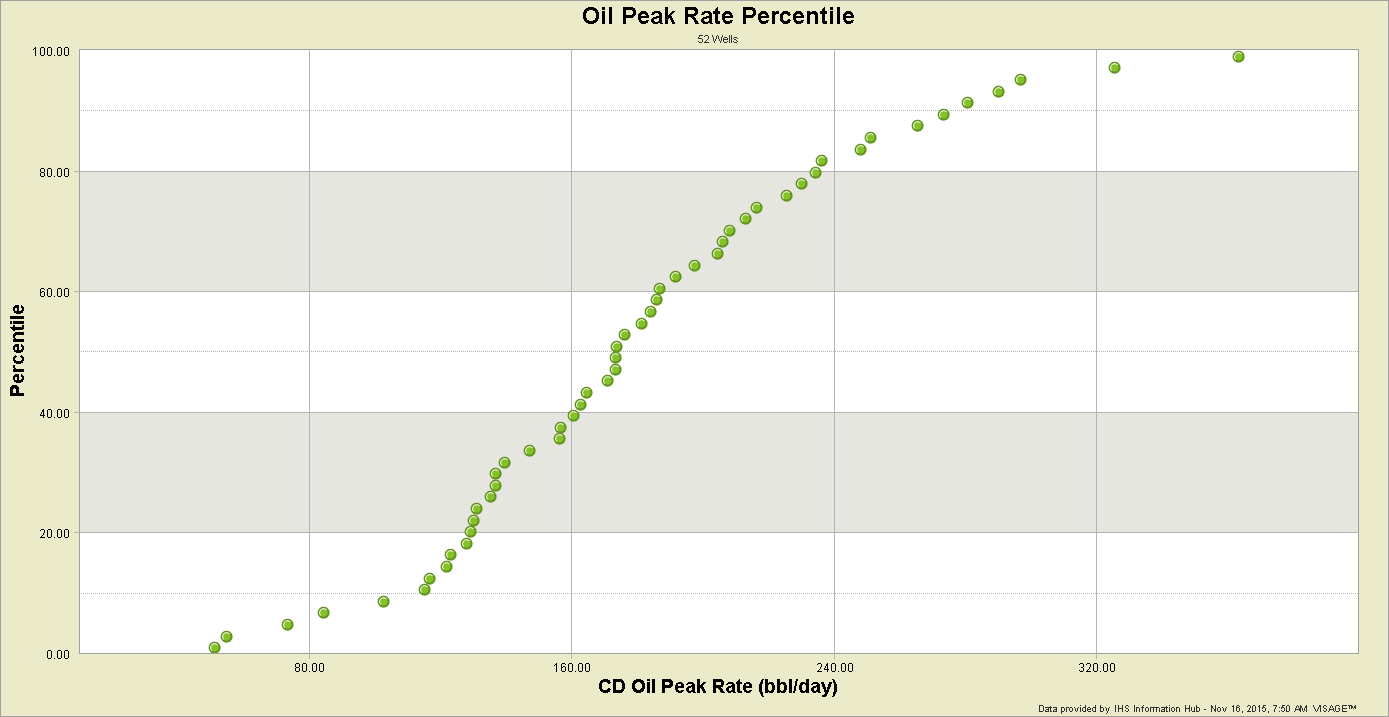
Percentile (Cumulative Probability) Charts: This chart type is an excellent tool for understanding statistical variability. The chart types mentioned above all display a single value for a collection of wells. Percentile charts display a value for each well at a single moment in time in the form of a distribution. Common variables that are displayed are:
- Average rate for a range of months
- Peak rate
- Cumulative production at N months
- EUR
- IP rates (e.g. IP90 = average daily production rate after 2160 hours)
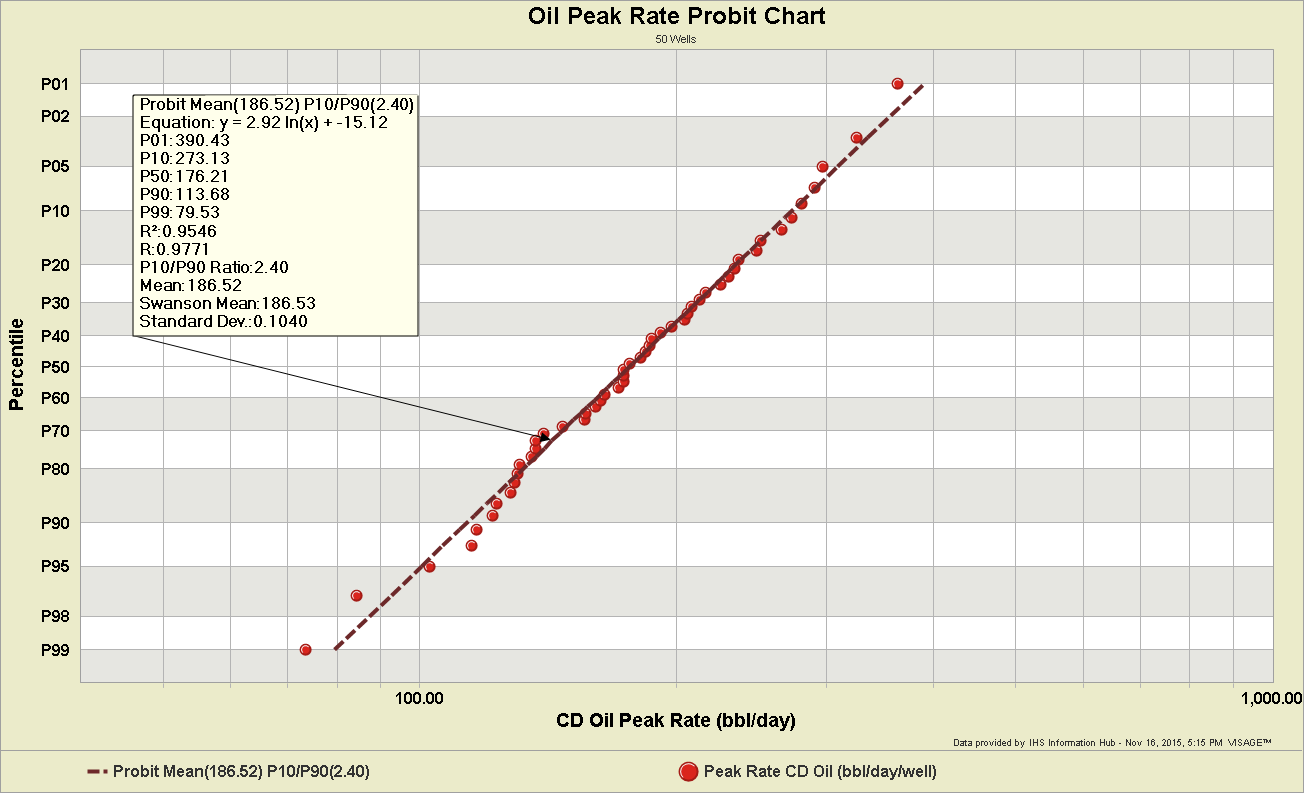
Probit Charts: A Probit Chart takes the same data used in a Percentile Chart and displays it using different scales. The Probit Scale, on the Y-axis, is a non-linear scale that is symmetrical around the P50. When combined with a log scale, on the X-Axis, the points of a lognormal distribution will trend towards a straight line. Applying a “Probit Best Fit” regression to the data will yield a straight line that provides a variety of statistical insights including a measure of uncertainty (P10/P90 ratio). More details about Probit Charts will be provided in a subsequent blog.
That concludes the first part of this series … sorry it was a bit long, but we needed to lay a clear foundation for the remaining topics. Additional topics that may be included in this series are:
- Selecting your analogue (how to reduce variability
- Normalizing your production data
- Calendar Day vs Producing Day
- Condensing Time
- Survivor Bias
- Truncate and Forecast or Auto-forecast
- Measuring Uncertainty
About Bertrand Groulx
Bertrand Groulx is a well-respected oil and gas industry expert with almost 30 years of experience driving innovation and developing advanced solutions. He possesses deep knowledge and understanding of data analytics in the sector, which has allowed him to deliver unparalleled enhancements to Omnira Software's VERDAZO and MOSAIC software products. Bertrand's extensive accomplishments in the public and private sectors and his scientific publications and presentations on machine learning, visual analytics, and completion optimization have made him a thought leader. With a B.S. Honors in Geology and Geology and Geomorphology from the University of British Columbia, Bertrand focuses on enhancing Omnira Software's business intelligence and discovery analytics products in his current role, particularly the VERDAZO platform's growth and development. As a blog author, Bertrand shares his unique expertise and insights, offering valuable knowledge and guidance to industry professionals seeking to stay at the forefront of the constantly evolving oil and gas landscape.
