Privacy Notice: This website uses analytics and marketing cookies to understand reader behavior and improve content. By continuing to browse or engage with this site, you consent to our use of cookies. See our Privacy Policy for details.
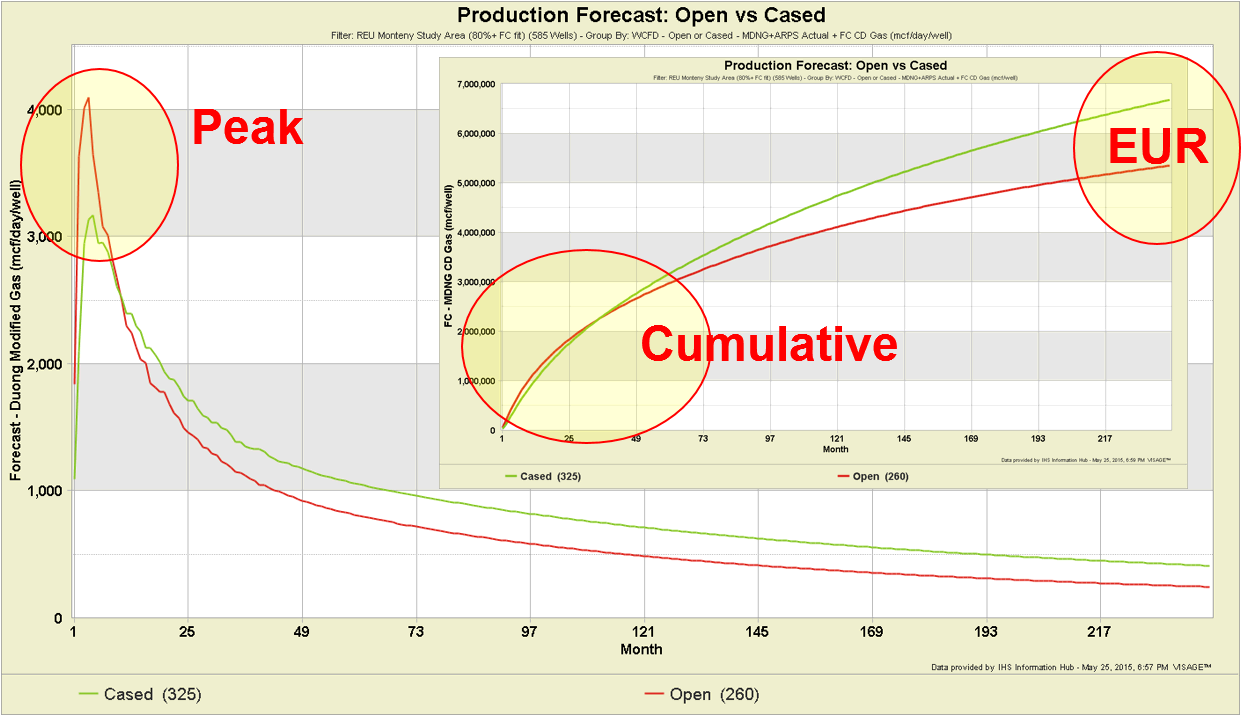
Measuring and comparing well production performance is the foundation of production analysis in the oil and gas industry. The challenge is deciding what production performance measure to use and understanding their strengths and weaknesses. To illustrate this, take a look at the following charts which compare the average production profiles of Open Hole completions to Cased completions in a Montney study area. Three different production measures will yield three different conclusions:
- using Peak Rate, I would conclude that Open is dramatically better than Cased
- using Cumulative Production after 36 months, I would conclude that Open and Cased are about the same
- using EUR, I would conclude that Cased is better than Open
Why measure production performance?
- Measure performance against an expectation or plan
- Compare wells, plays, companies, technologies …. to one another
- Gain insights into optimal performance design (e.g. proppant loading, frac spacing, horizontal direction …)
- Use as a proxy for EUR (I’ll cover this in detail in my next blog with a comprehensive correlation analysis on four different plays)
What production measures are there?
While there are more production measures than I’ve listed below, I have limited today’s discussion to these four:
- Peak Rate
- IP30, IP60, IP90, IP180, IP365…
- Cumulative Production in the first N months ( a variant of this is Avg Rate in the first N months)
- EUR
What are their strengths & weaknesses?
In all cases, these production measures put wells into a consistent comparable context. However, this can sometimes be at the expense of other considerations.
Peak Rate
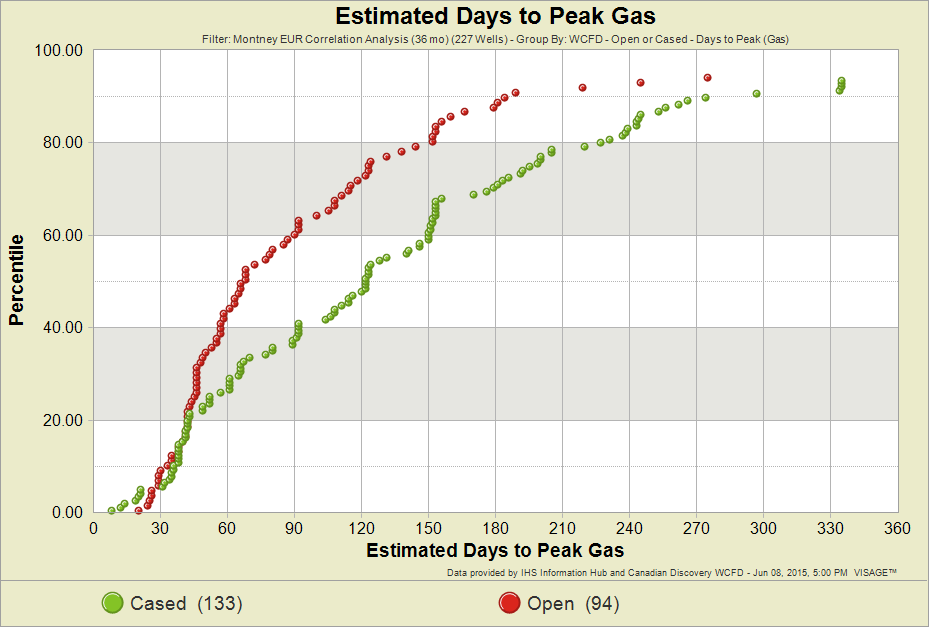
The Peak Rate is the starting point of a production decline which can be a valuable comparative measure. The weaknesses are:
- The time elapsed to get to Peak (see chart below) is highly variable and doesn’t take into consideration the volume recovered before hitting Peak
- Flow constrained (choked) wells will report a lower “peak” than what they were capable of
- What is being reported as Peak (i.e. Peak to Date) may not be the actual Peak that will be achieved (i.e. you don’t know you’ve hit peak until you’ve passed it)
- The correlation to EUR is moderate
IP30, IP60, IP90 …
IP (which stands for Initial Production) is the average daily rate after a cumulative number of hours. For example, IP90 is the average daily production rate after 2160 hours of production (i.e. there are 2160 hours in 90 days). IP measures have become increasingly popular, particularly in the financial world, but should be used with caution. The main concerns are:
- There is no indication of the elapsed time
- average of 79 days to get Oil IP30 on a collection of Bakken, Viking and Cardium wells (2578 wells)
- average of 101 days to get Gas IP30 on a Montney sample set (518 wells)
- Elapsed time could include soaking of gas wells or a significant amount of problems with the well (i.e. downtime is “hidden” in IP values)
- Gas wells with significant downtime could exhibit flush production and skew results
- IP values have a weak to moderate correlation to EUR
- The shorter the time frame the more it is dominated by ramp up time (and less representative of production potential)
Cumulative Production in the first N months
This represents the cumulative production at a point in time. You can choose to include zero production months or exclude them (i.e. condensing the data). The primary considerations are:
- This measure is not well suited as a near term performance indicator (i.e. with less than 3 months of data)
- Including more months of data is better
- It has a moderate to strong correlation to EUR (with 6 to 18+ months of data)
EUR
Estimated Ultimate Recoverable (EUR) is an “estimate”, which should make you ask the question, “How good is my estimate?” Some considerations are:
- You need enough production data to begin to formulate a reasonable estimate
- Multi-stage horizontal wells and completion technologies introduce complexity
- Forecasts are time consuming if done manually
- The reliability of auto-forecasting techniques can vary … for a lot of reasons
- EUR is not always the best indicator of “value” … the shape of the production profile combined with discounting can dramatically influence value
Conclusion
- Be aware of the strengths and weaknesses of each production measure (in the context of your play or an appropriate analogue)
- Don’t rely on just one production measure
- Build a narrative … several production measures can tell a more complete story
Frac Data provided by: Well Completions and Frac Database from Canadian Discovery
Production data: IHS Information Hub
Analysis: VERDAZO
Thanks for reading. We welcome your questions and suggestions for future blogs.
