Privacy Notice: This website uses analytics and marketing cookies to understand reader behavior and improve content. By continuing to browse or engage with this site, you consent to our use of cookies. See our Privacy Policy for details.
Editor’s Note: With VERDAZO proudly joining Omnira Software in 2022, this blog is being re-published on the Omnira Software website.
The first step in developing your Type-well Curve is the selection of your analogue wells. Analogue wells should have a similarity on which a comparison may be based and should represent the range of possible outcomes (i.e. don’t just select the best wells). However, by selecting wells with similar characteristics you can reduce the range of uncertainty in your type-well curve. The more common well attribute categories that are considered when selecting analogue wells include:
- Geology
- Reservoir
- Well Design
- Well Density
- Operational Design
Here are some insights and perspectives on these well attribute categories that should shed some light on the importance of a thoughtful analogue well selection process. Tools like VERDAZO can help make this process much faster and easier.
Geology and Reservoir
While there is data from public data vendors that can contribute to your geological and reservoir understanding, it is largely going to come from studies and the knowledge base built by your internal geologists and geophysicists. Use of maps to provide a geographical context in your analogue well selections is important. Possible distinctions between Geology and Reservoir are:
- Geology pertains to criteria like thickness, porosity, permeability, lithology, water saturation, faulting/fracturing etc.
- Reservoir pertains to fluids, thermal maturity, pressure, temperature etc.
Well Design
Well design includes a variety of parameters, most of which revolve around the completion. They include, but are not limited to, open/cased, lateral length, technology, fluids, energizers, proppant loading, and stages (number and spacing). When you are building your type-well curve you can group the wells by any of the well design parameters along with vintage, operator… to see if you can further narrow down your analogue selection and reduce the uncertainty in your type-well curve. Some other approaches to gain even greater insight involve dimensional normalization (e.g. normalizing to lateral length) to put wells on a level playing field. I will discuss this in more detail later in this blog series.
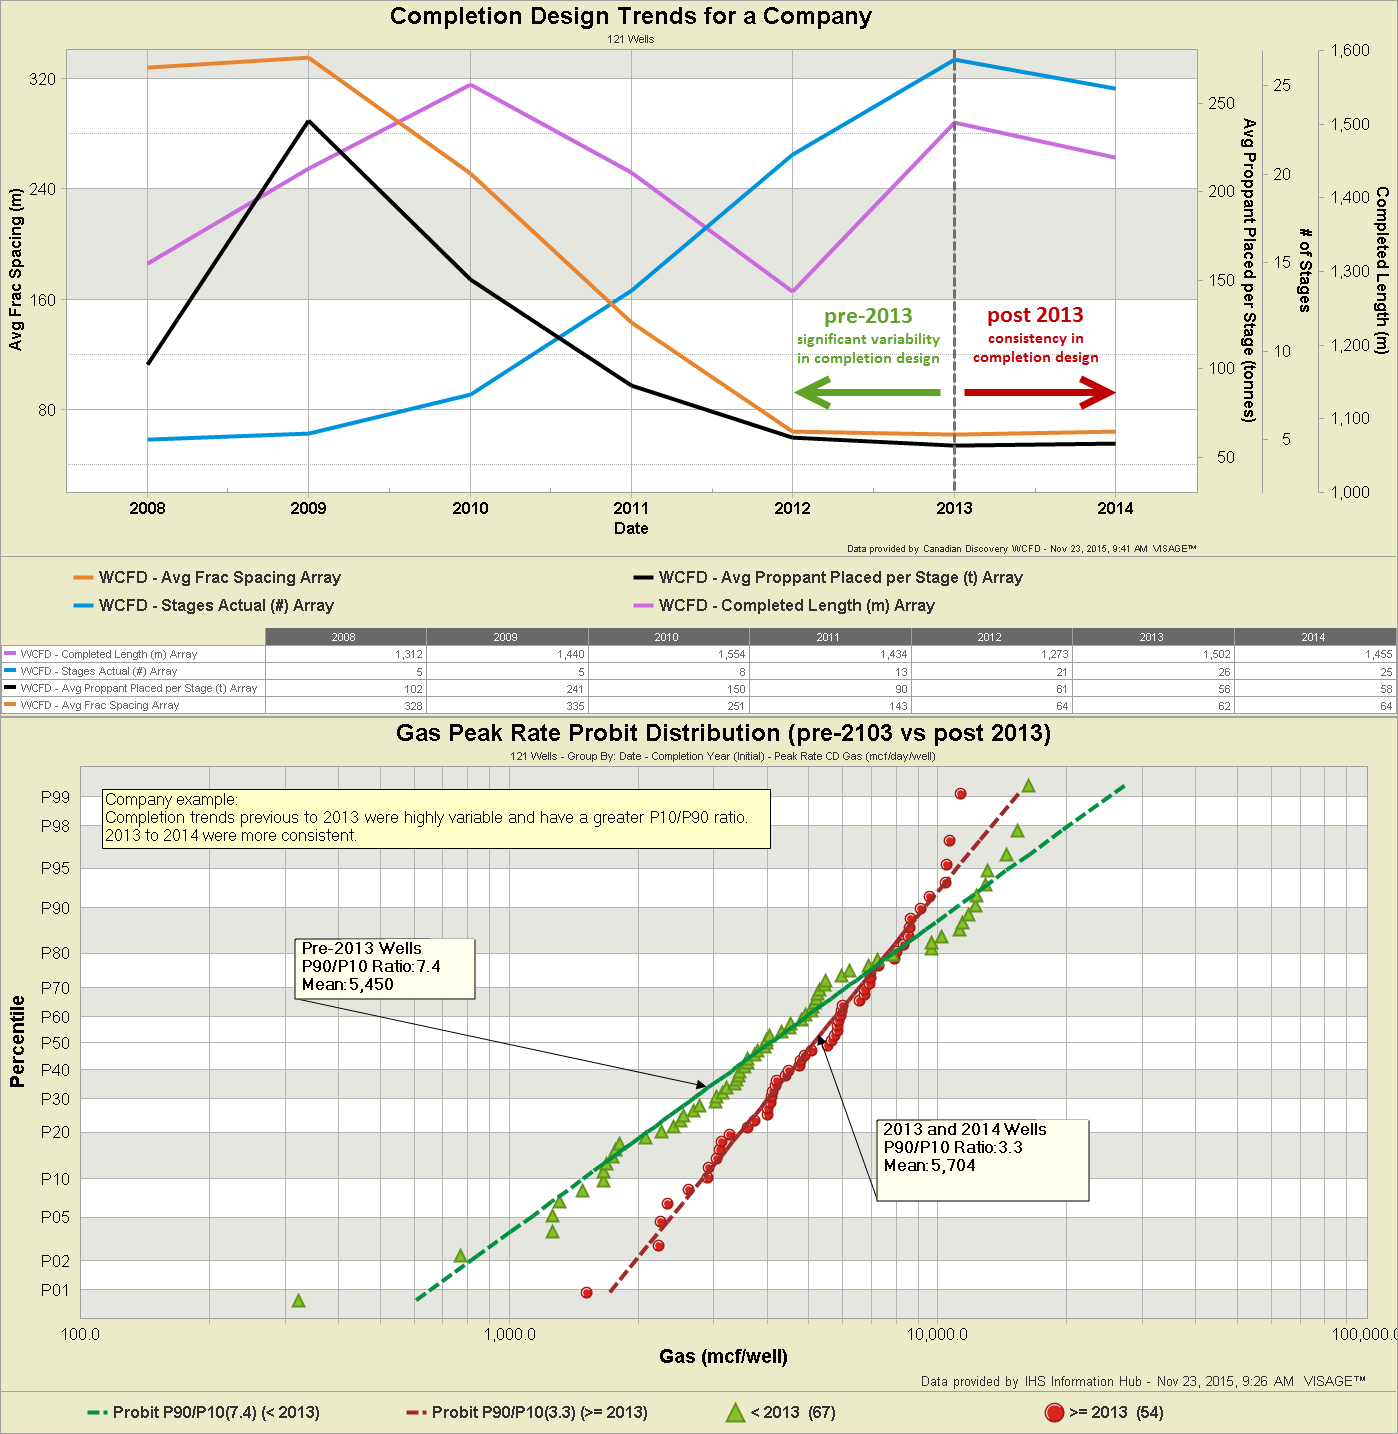
To illustrate the degree to which well design can affect uncertainty, I have created the following example. The top chart shows how the completion design parameters for a particular company, in a particular play, varied significantly previous to 2013. In 2013 and 2014, the completion parameters were quite consistent. The bottom chart is a probit plot (see previous blog) of peak rates for the two datasets (pre and post 2013). The P10/P90 ratio is a quantification of the range of uncertainty (i.e. statistical variability of the data). The more consistent completion designs post-2013 have a much lower P10/P90 ratio.
Well Density
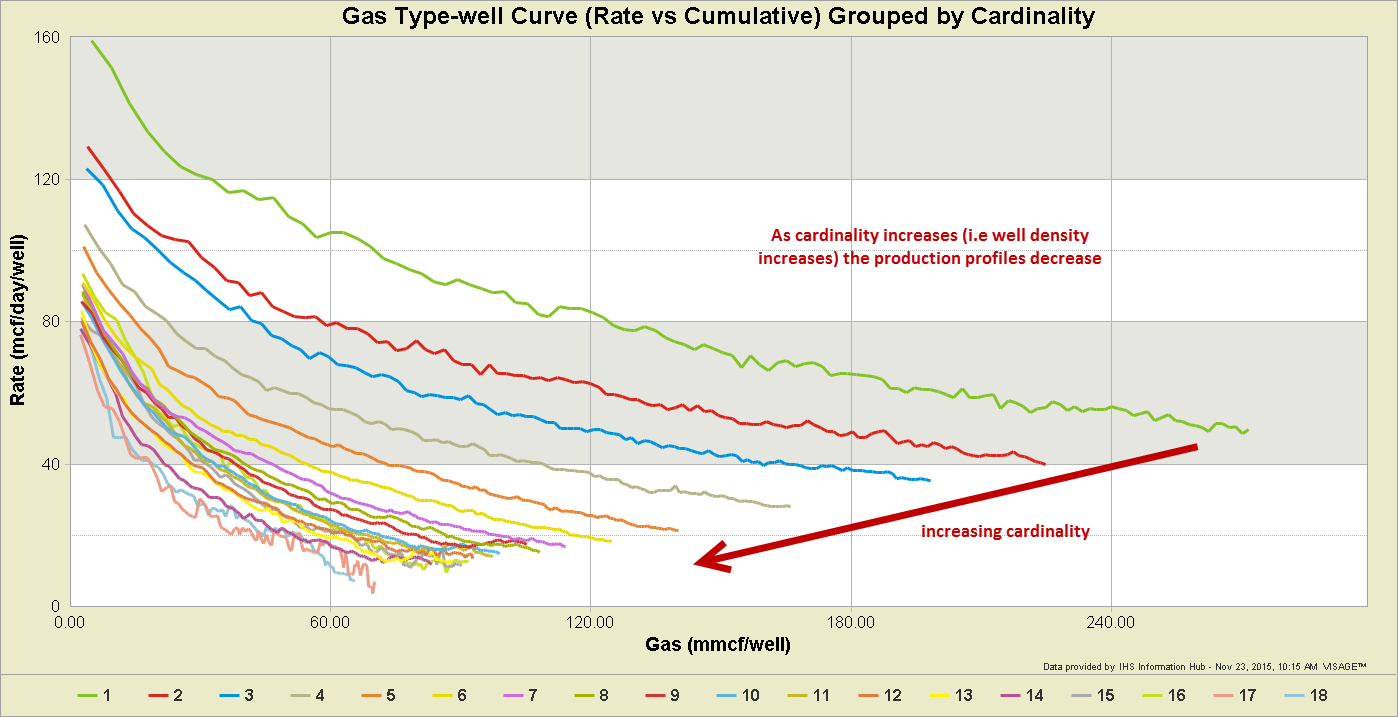
A way to measure well density is to use “cardinality”. Well cardinality represents the order in which wells were drilled within a square mile. Working with GLJ Petroleum Consultants, we wrote an algorithm that calculates the cardinality for each well in a dataset. It draws a one mile box around each well and determines if that well was the first, second, third… well drilled within that box. This calculation is repeated for each well. A higher cardinality is a higher measure of well density. The following example shows a Rate vs Cumulative Type-well Curve for 10,082 Milk River wells grouped by cardinality. You can clearly see a reduction in the production profiles as cardinality (i.e. well density) increases.
Operational Design
Two possible reasons for restrictions on production are those that are imposed on you in your particular operational environment and those you choose to do in pursuit of optimization. Capacity constraints (curtailment), contracts and operational constraints (line pressure) are examples of production restrictions imposed on you given your operational environment. With the increase in proppant loading and better deliverability some operational designs that you choose to impose may strive to maintain bottom hole pressure, control flowback of sand, minimize base decline, enhance production yields (e.g. condensate-gas ratio), or maximize EUR.
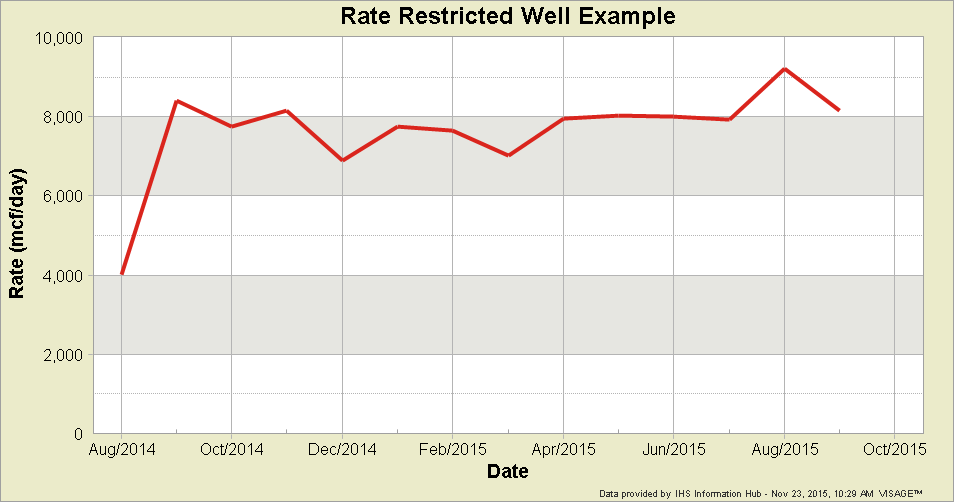
The easiest way to assess whether there are restrictions on the production of competitors’ wells in the public domain is to scroll through your dataset and look at each well individually. You may be able to isolate and exclude wells that do not demonstrate expected production decline behaviour, or in some cases where declines begin after an extended period of rate restriction, you can sometimes manually adjust the normalization dates and include those wells. The following single well example is clearly flow restricted and does not exhibit any decline behaviour yet. This well would likely be excluded from an analogue well selection.
That concludes part 2 of this series. The remaining topics that will be included are:
- Normalizing your production data
- Calendar Day vs Producing Day
- Condensing Time
- Survivor Bias
- Truncate and Forecast or Auto-forecast
- Measuring Uncertainty
___________________________________________________________
About Bertrand Groulx
Bertrand Groulx is a well-respected oil and gas industry expert with almost 30 years of experience driving innovation and developing advanced solutions. He possesses deep knowledge and understanding of data analytics in the sector, which has allowed him to deliver unparalleled enhancements to Omnira Software's VERDAZO and MOSAIC software products. Bertrand's extensive accomplishments in the public and private sectors and his scientific publications and presentations on machine learning, visual analytics, and completion optimization have made him a thought leader. With a B.S. Honors in Geology and Geology and Geomorphology from the University of British Columbia, Bertrand focuses on enhancing Omnira Software's business intelligence and discovery analytics products in his current role, particularly the VERDAZO platform's growth and development. As a blog author, Bertrand shares his unique expertise and insights, offering valuable knowledge and guidance to industry professionals seeking to stay at the forefront of the constantly evolving oil and gas landscape.
Production data: IHS Information Hub
Completion and Frac Data: Well Completions and Frac Database from Canadian Discovery
Analysis: VERDAZO
Some other blogs you may find of interest:
- Type Curves Part 1: Definitions and Chart Types
- What production performance measure should I use?
- Frac Analysis in VERDAZO: Using Distributions as an Alternative to Linear Regressions
- Frac Analysis in VERDAZO: How to Refine Your Insights Using Distribution
About Bertrand Groulx
Bertrand Groulx is a well-respected oil and gas industry expert with almost 30 years of experience driving innovation and developing advanced solutions. He possesses deep knowledge and understanding of data analytics in the sector, which has allowed him to deliver unparalleled enhancements to Omnira Software's VERDAZO and MOSAIC software products. Bertrand's extensive accomplishments in the public and private sectors and his scientific publications and presentations on machine learning, visual analytics, and completion optimization have made him a thought leader. With a B.S. Honors in Geology and Geology and Geomorphology from the University of British Columbia, Bertrand focuses on enhancing Omnira Software's business intelligence and discovery analytics products in his current role, particularly the VERDAZO platform's growth and development. As a blog author, Bertrand shares his unique expertise and insights, offering valuable knowledge and guidance to industry professionals seeking to stay at the forefront of the constantly evolving oil and gas landscape.
