I love a good superhero origin story, bringing you back to the experiences that define the character’s core values. It turns out it serves the same purpose for software, reminding us of the root problems that we strived to solve and the vision of how things should be done. It served that purpose for us when deciding to develop VERDAZO’s automated data feed for Power BI dashboards… leveraging our enterprise data governance and centralized business logic with a clear audit trail. It allows VERDAZO to serve as a data curation tool, where dashboard-builders can surf through a full inventory of data and information, dimension it to meet their specific needs and forego the time and effort required to set up tables, links, and re-build calculations. It introduces yet another way that VERDAZO expedites the delivery of reliable information to an even bigger audience and further embraces its role in Master Data Management.
But before we get into too many details, let’s revisit VERDAZO’s Origin Story to see where this, perhaps unexpected, inspiration came from.
The Problem that fueled our Origin Story
In the early to mid-2000s, oil & gas companies started to push for more governed information delivery. Along came Data Warehouses, with the promise to be a reliable, governed data source = a single source of truth. Creating Data Warehouses was expensive, took a lot of time and resources to build, and was biased toward financial data. Data Warehouses didn’t contain the technical information needed by operations and engineering; a group of users making time-sensitive decisions on a daily basis leveraging many data sources (e.g., Field Data Capture, Well Lifecycle, Financial, Forecasts).
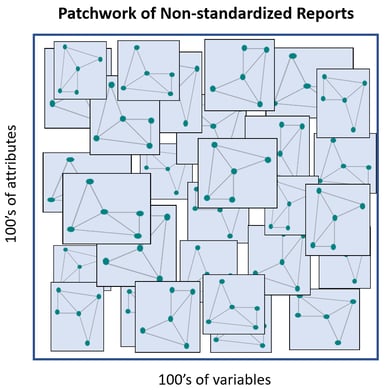
People took it upon themselves to build their own reports (typically Excel files). The reports were never adequate, always needing another column here, another drill-down there. This resulted in the proliferation and duplication of reports/Excel files. The patchwork of non-standardized reports became increasingly challenging to maintain and troubleshoot without a clear data audit trail.

This is the information-delivery mess that fueled the genesis of VERDAZO!

The Origin Story of “Discovery Analytics”
Our vision was initially informed by years of industry experience in upstream economic decisions, uncertainty & risk analysis and planning & optimization. We started with value-driven decisions and worked backwards to ask a bunch of “what if” questions:
- What if a Data Warehouse wasn’t necessary and we connected directly to (copies of) system tables?
- What if we mapped to all of the data, but only grabbed the data when it was needed, on demand?
- What if the business logic was centralized, in terms of cross-system integrations, conversion factors and calculations? Change the logic in one spot and it propagates everywhere!
- What if we could implement in weeks (instead of months or years) and adding new information took minutes?
- What if we used interactive charts (visual analytics) to
- Select whatever information you want to see from a full inventory of data.
- Create reusable lists of wells, or cost centers, that could be dynamically generated at runtime.
- Provide detailed drill down for full transparency.
- Deliver unscripted investigative analysis workflows? (i.e., a visual database interrogation tool… we called this “Discovery Analytics”)
- Support collaboration with peers?
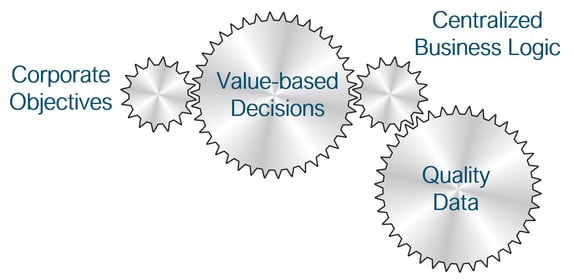
We knew this was more than technology development, it was a process enabler where quality trusted data, with centralized business logic, would fuel value-based decisions that were aligned with corporate objectives. It proved to do exactly this when we had clients adopt it for day-to-day analysis and use it for regular Asset Reviews. Centralized business logic became one of VERDAZO’s key differentiators that no data warehouse solution, or dashboard solution, has adequately addressed.

Beyond that, there were many Oil & Gas specific analysis needs that weren’t easy to accomplish in other tools. To make engineers as efficient as possible we had to add many unique capabilities (that are tough to do in Power BI):
- Type-curve best practices, including solving the survivor bias problem
- Dynamic well list management
- Expert-informed statistical techniques to make it easier to include uncertainty in workflows
- Industry-specific KPI’s, diagnostic measures & investigative workflows to support Integrated Operations Management Goals (this became the backbone of Asset reviews… to be discussed in a future blog
- Automation to push alerts and notifications
We also knew it was important to contribute to the Oil & Gas community by sharing the best practices that we developed working with industry experts and innovators. Over a decade we published more than 80 blogs and industry presentations and were recognized by the SPE with the 2016 Regional Production and Operations Award.
Fast forward to today: The more things change, the more they stay the same
Today, many companies are still building data warehouses of various kinds to feed dashboards and visual reporting tools.
It is common in many companies to have managed/published dashboards built for an executive or management audience. However, there are also end-users who have very specific needs and end up building their own dashboards to support their analysis and workflows. Each dashboard contains business logic that is not centralized, and thus not always consistent. The end result is often a proliferation of dashboards that eventually break, aren’t up to date and don’t have a clear audit trail.
Clients have stated, "It's exactly the same as the Excel proliferation problem in the early 2000s, just with fancier dashboards this time."
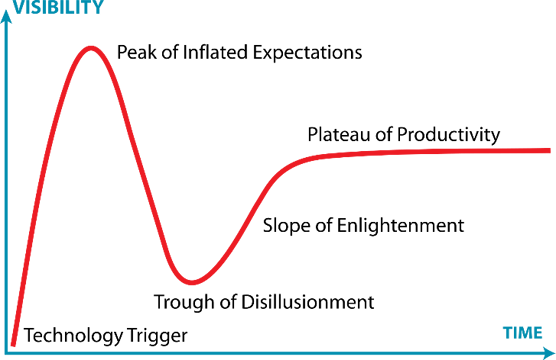
In fact, it follows the same Gartner Hype Cycle of emerging technologies where, in this case, the trough of disillusionment is when a proliferation of dashboards starts to break, users lose trust and there is no clear audit trail.

Introducing VERDAZO’s Automated Power BI Data Feed
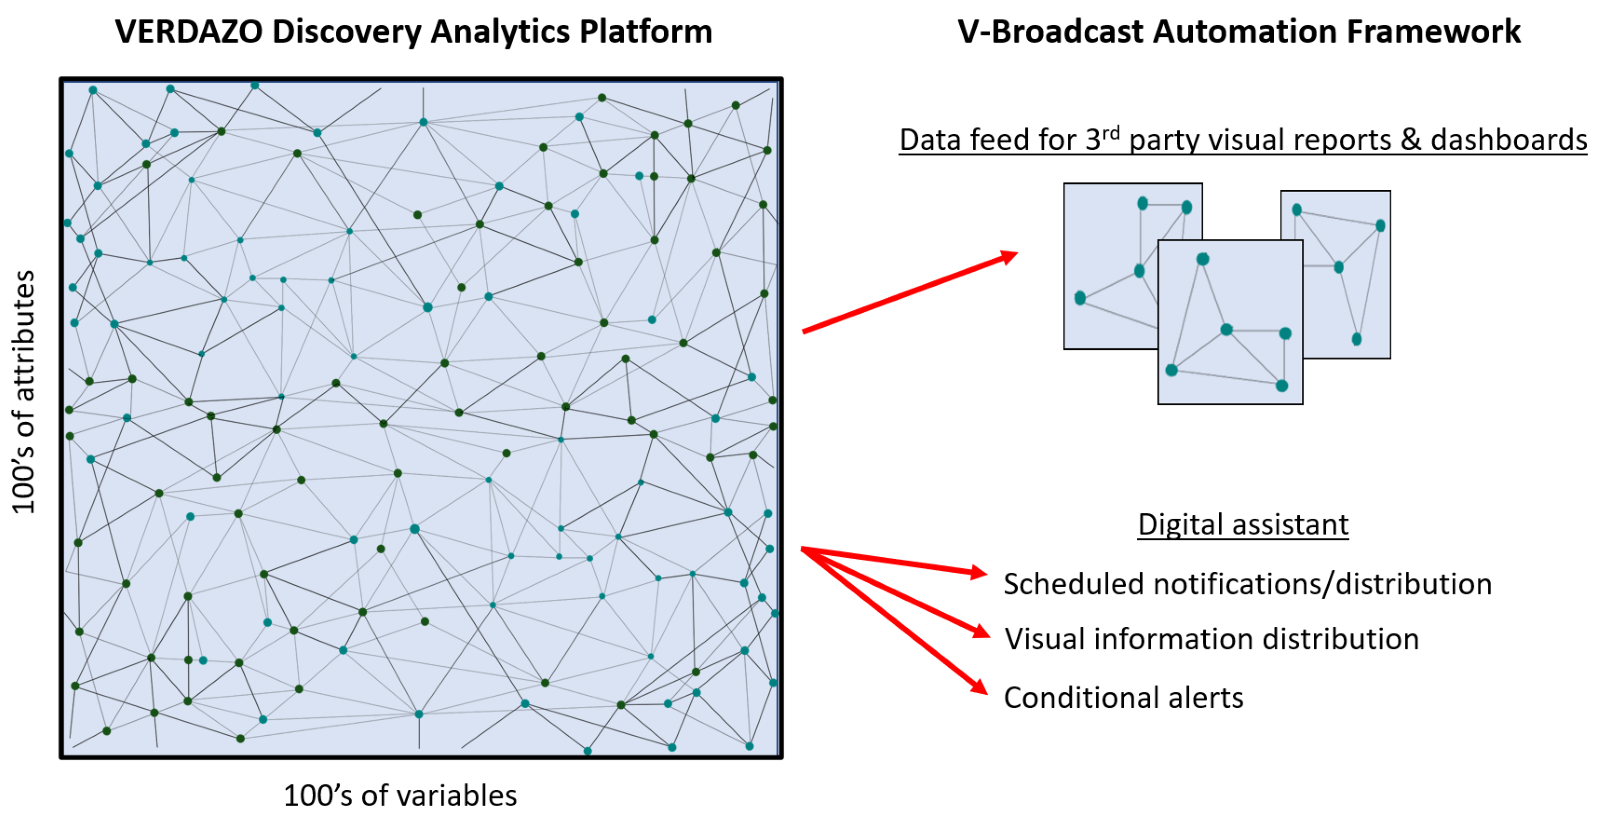
We decided that we could best serve our client’s needs by leveraging our enterprise approach to data governance, and centralized business logic, to deliver reliable information to a larger audience. Not only can we provide scheduled notifications and alerts through our automation framework, V-Broadcast, we can also feed data to tools that serve all parts of the organization through our Power BI Data Feed.

If you would like to learn more about our Power BI Data Feed or how VERDAZO can be part of your Master Data Management strategy, we would love to hear from you.
About Bertrand Groulx
Bertrand Groulx is a well-respected oil and gas industry expert with almost 30 years of experience driving innovation and developing advanced solutions. He possesses deep knowledge and understanding of data analytics in the sector, which has allowed him to deliver unparalleled enhancements to Omnira Software's VERDAZO and MOSAIC software products. Bertrand's extensive accomplishments in the public and private sectors and his scientific publications and presentations on machine learning, visual analytics, and completion optimization have made him a thought leader. With a B.S. Honors in Geology and Geology and Geomorphology from the University of British Columbia, Bertrand focuses on enhancing Omnira Software's business intelligence and discovery analytics products in his current role, particularly the VERDAZO platform's growth and development. As a blog author, Bertrand shares his unique expertise and insights, offering valuable knowledge and guidance to industry professionals seeking to stay at the forefront of the constantly evolving oil and gas landscape.

