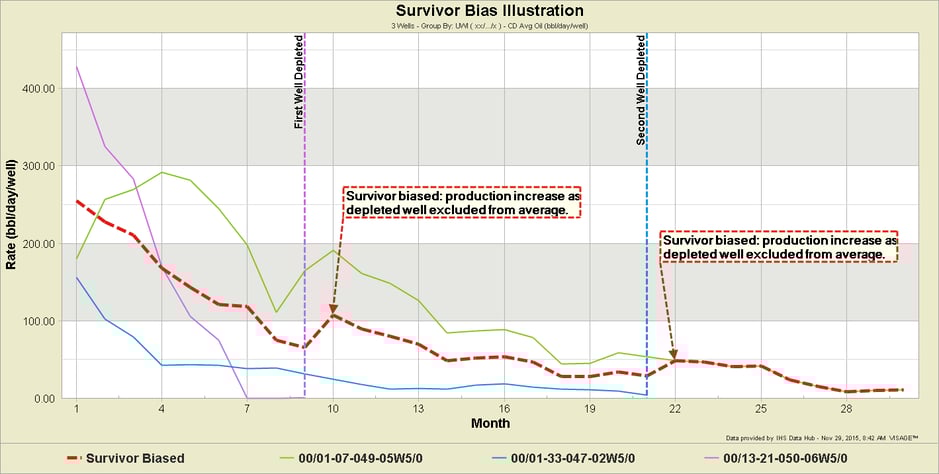
A common issue with Type-well Curves is that they are “Survivor Biased”, and can provide an unrealistic (optimistic) production outlook.
Survivor Bias Definition: as depleted wells are excluded from the monthly average-production-per-well calculation, the Type-well Curve values are biased by the surviving wells (i.e. wells that are still producing). As such the Type-well Curve does not reflect the actual average production one might expect taking into account wells that are depleted (or shut-in permanently).
This chart illustrates how Survivor Bias can cause latter-life production increases in a Type-well Curve.
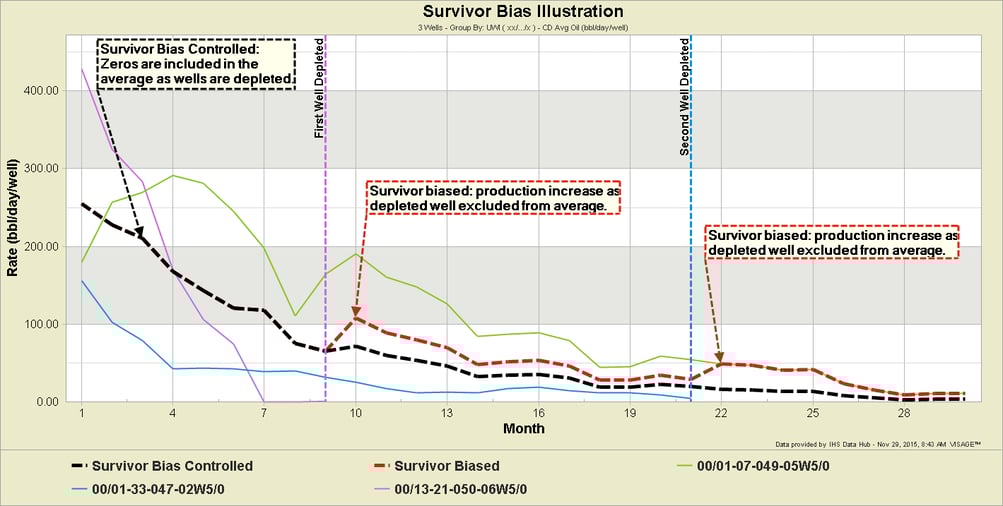
Few software products provide Survivor-Bias Controls that allow you to include zeros in the production average after wells are identifiably depleted. The challenge when dealing with public production data is how to identify that a well is depleted. At VERDAZO we chose to use a “period of non-production” as the mechanism to identify a depleted well. The user can define the length of this period (e.g. if a well has not produced in the last 12 months, then consider it to be depleted … meaning it is not expected to come on production again).
The following chart illustrates how Survivor Bias Controls can provide a more realistic expectation of production when depleted wells are included in your Analogue Well Selection.
Challenges of the Current Commodity Price Market
The current commodity price market will make identifying depleted wells more complicated. Increasingly companies are shutting-in wells until commodity prices recover to an economically acceptable level. This means that a larger window of non-production may need to be specified to identify a “depleted” well. Regardless, this is a poignant reminder that careful attention should be made to your Analogue Selection and every aspect of the choices you make when generating your Type-well Curve.
That concludes part 7 of this series. The remaining topics that you can look forward to include:
- Truncation Using Sample Size Cut-off
- Forecast the Average vs Average the Forecasts
- Representing Uncertainty
- Auto-forecast
___________________________________________________________
About Bertrand Groulx
Bertrand Groulx is a well-respected oil and gas industry expert with almost 30 years of experience driving innovation and developing advanced solutions. He possesses deep knowledge and understanding of data analytics in the sector, which has allowed him to deliver unparalleled enhancements to Omnira Software's VERDAZO and MOSAIC software products. Bertrand's extensive accomplishments in the public and private sectors and his scientific publications and presentations on machine learning, visual analytics, and completion optimization have made him a thought leader. With a B.S. Honors in Geology and Geology and Geomorphology from the University of British Columbia, Bertrand focuses on enhancing Omnira Software's business intelligence and discovery analytics products in his current role, particularly the VERDAZO platform's growth and development. As a blog author, Bertrand shares his unique expertise and insights, offering valuable knowledge and guidance to industry professionals seeking to stay at the forefront of the constantly evolving oil and gas landscape.
Production data: IHS Information Hub
Analysis: VERDAZO
Thanks for reading. We welcome your questions and suggestions for future blogs.
Some other blogs you may find of interest:
