Editor’s Note: With VERDAZO proudly joining Omnira Software in 2022, this blog is being re-published on the Omnira Software website.
Type-well Curves that use Calendar Day production rates can yield very different results than Producing Day production rates. Each approach has its own strengths and weaknesses. Understanding how best to leverage their strengths and be cautious of the dangers is an important part of creating and using type-well curves. You can also combine the two to get valuable insights about the operational efficiency of a collection of wells.
Calendar Day Rate = (monthly volume) / (days in month)
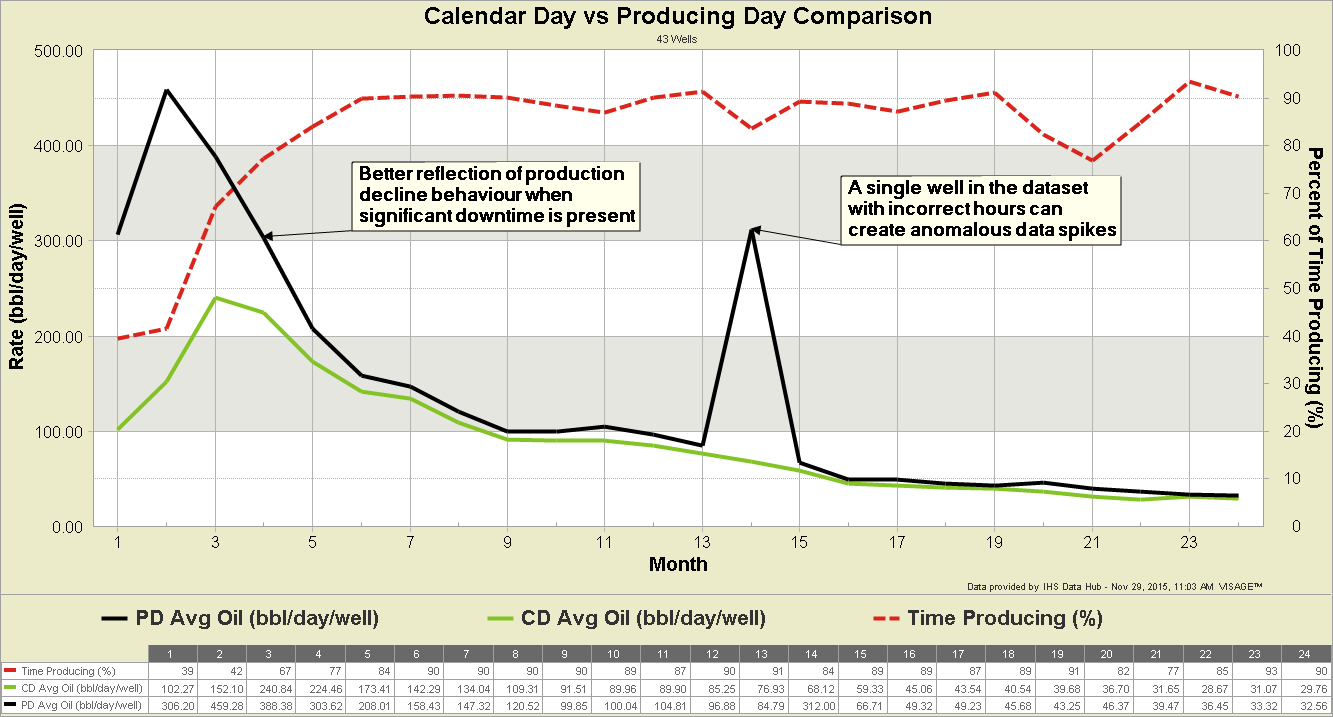
The strength of using Calendar Day (CD) rates is that they are inherently representative of operational reality (i.e. what actually happened). Thus they are well suited for comparing the operational performance of companies, vintages, technologies etc. The weakness is that if there is significant downtime the shape of the type-well curve may not reflect the expected decline behaviour.
Producing Day Rate = (monthly volume) / (hours producing in the month) * 24
The strength of using Producing Day (PD) rates is that they may more accurately reflect production decline behaviour when significant downtime occurs. However, there are several dangers to be aware of when using PD rates in type-well curves:
- PD rates inflate every production month’s value (which has downtime) and can overestimate the Estimated Ultimate Recoverable (EUR) potential of a well. The degree to which the EUR could be inflated is often proportional to the amount of downtime. For example, if the first month has significant downtime, the inflated PD rate reflects a significant volume that was not produced. If that volume were produced it would have an impact on what the rate would be in the second month (i.e. you would expect it to be lower).
- Flush production on gas wells after extended downtime (e.g. plant turnaround) can cause significant PD rate spikes.
- PD rates rely on accurate reporting of producing hours. Incorrect hours can cause anomalous data spikes.
The following chart illustrates the strengths and weaknesses of using CD and PD rates in type-well curves.
Measuring Operational Efficiency Using CD and PD Rates
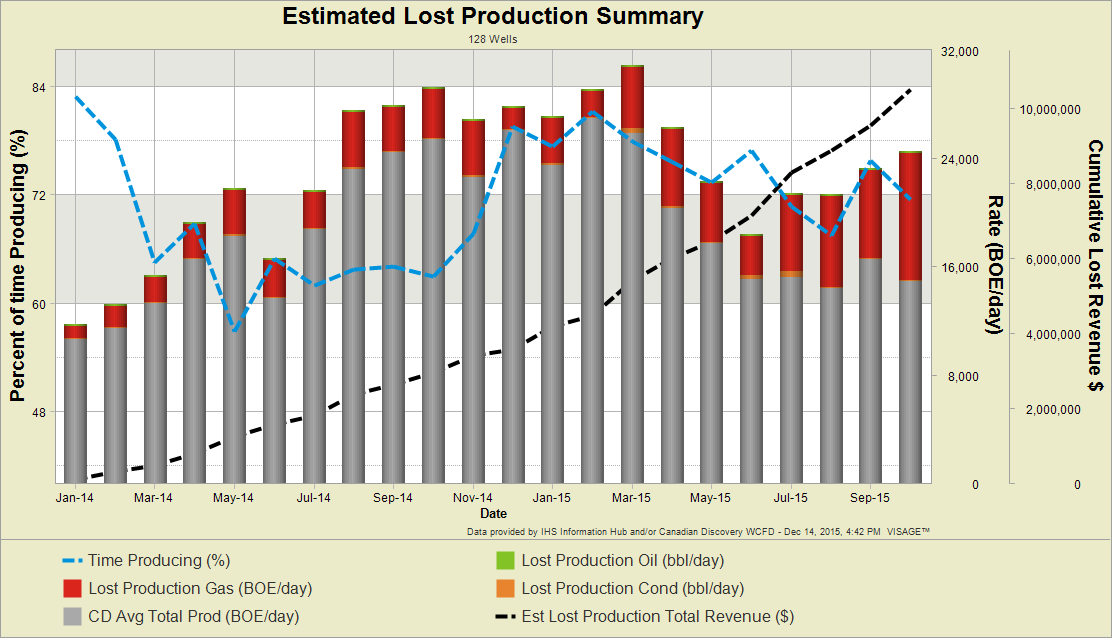
The delta between the PD rate and CD rate is a reasonable estimate of the production that was not achieved due to downtime. We refer to this as Lost Production and discuss it in more detail in the blog Lost Production in VERDAZO: Not All Downtime is Created Equal. One of the special adjustments we make when using public data that helps us avoid anomalous data spikes in our Lost Production calculations is to exclude any PD rates that exceed a well’s CD peak rate. Using Lost Production you can derive a measure of operational efficiency that could be a useful insight to adjust “Idealized” type-well curves … this topic will be covered in early 2016.
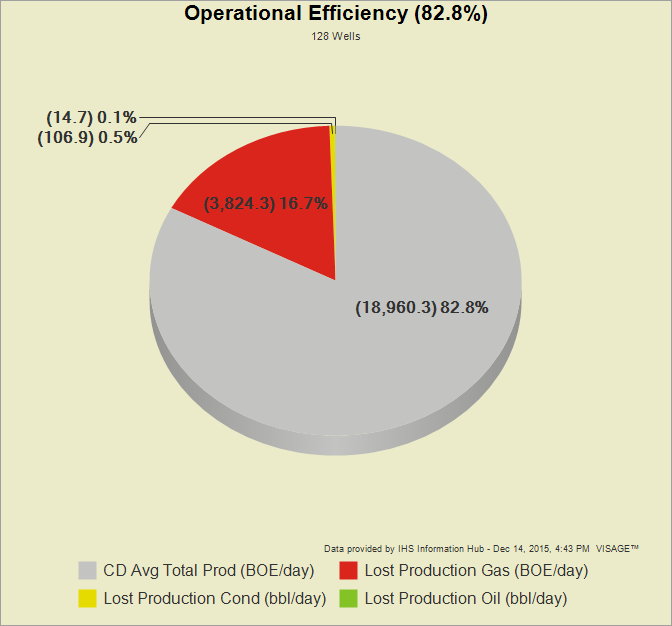
The following chart shows the estimated Lost Production due to downtime for an Operator, the Percent of Time Producing each month and the Estimated Cumulative Lost Revenue associated with the downtime. The second chart quantifies the Operational Efficiency of those same wells (i.e. approximately 82.8% of potential production was achieved in the date range).
That concludes part 4 of this series. The remaining topics that you can look forward to include:
- Condensing Time
- Operational/Downtime Factors on Idealized Curves
- Survivor Bias
- Truncation Using Sample Size Cut-off
- Forecast the Average vs Average the Forecasts
- Representing Uncertainty
- Auto-forecast Tools
__________________________________________
About Bertrand Groulx
Bertrand Groulx is a well-respected oil and gas industry expert with almost 30 years of experience driving innovation and developing advanced solutions. He possesses deep knowledge and understanding of data analytics in the sector, which has allowed him to deliver unparalleled enhancements to Omnira Software's VERDAZO and MOSAIC software products. Bertrand's extensive accomplishments in the public and private sectors and his scientific publications and presentations on machine learning, visual analytics, and completion optimization have made him a thought leader. With a B.S. Honors in Geology and Geology and Geomorphology from the University of British Columbia, Bertrand focuses on enhancing Omnira Software's business intelligence and discovery analytics products in his current role, particularly the VERDAZO platform's growth and development. As a blog author, Bertrand shares his unique expertise and insights, offering valuable knowledge and guidance to industry professionals seeking to stay at the forefront of the constantly evolving oil and gas landscape.
Production data: IHS Information Hub
Analysis: VERDAZO
Some other blogs you may find of interest:
- Type Curves Part 1: Definitions and Chart Types
- Type Curves Part 2: Analogue Selection
- Type Curves Part 3: Normalization
- What production performance measure should I use?
- Frac Analysis in VERDAZO: How to Refine Your Insights Using Distribution
About Bertrand Groulx
Bertrand Groulx is a well-respected oil and gas industry expert with almost 30 years of experience driving innovation and developing advanced solutions. He possesses deep knowledge and understanding of data analytics in the sector, which has allowed him to deliver unparalleled enhancements to Omnira Software's VERDAZO and MOSAIC software products. Bertrand's extensive accomplishments in the public and private sectors and his scientific publications and presentations on machine learning, visual analytics, and completion optimization have made him a thought leader. With a B.S. Honors in Geology and Geology and Geomorphology from the University of British Columbia, Bertrand focuses on enhancing Omnira Software's business intelligence and discovery analytics products in his current role, particularly the VERDAZO platform's growth and development. As a blog author, Bertrand shares his unique expertise and insights, offering valuable knowledge and guidance to industry professionals seeking to stay at the forefront of the constantly evolving oil and gas landscape.
