Privacy Notice: This website uses analytics and marketing cookies to understand reader behavior and improve content. By continuing to browse or engage with this site, you consent to our use of cookies. See our Privacy Policy for details.
Editor’s Note: With VERDAZO proudly joining Omnira Software in 2022, this blog is being re-published on the Omnira Software website.
A technique that is often used to compare wells or to augment the production decline profile of a well is “condensing time”. While this technique has its merits, it should be used with caution… it results in an “Idealized Type-well Curve” that may significantly over-represent the production (and value) you can expect from a well. You run the risk of falling short of your production targets if you don’t take into account realistic downtime expectations (I will discuss this in detail next week). This should give an even greater impetus for decision makers to ask, “How did you develop your type-well curve?”.
The two most common techniques used to condense time include: 1) Removing Time Periods with no (or low) production; and 2) measuring production in the context of “Cumulative Producing Time”.
Removing Time Periods
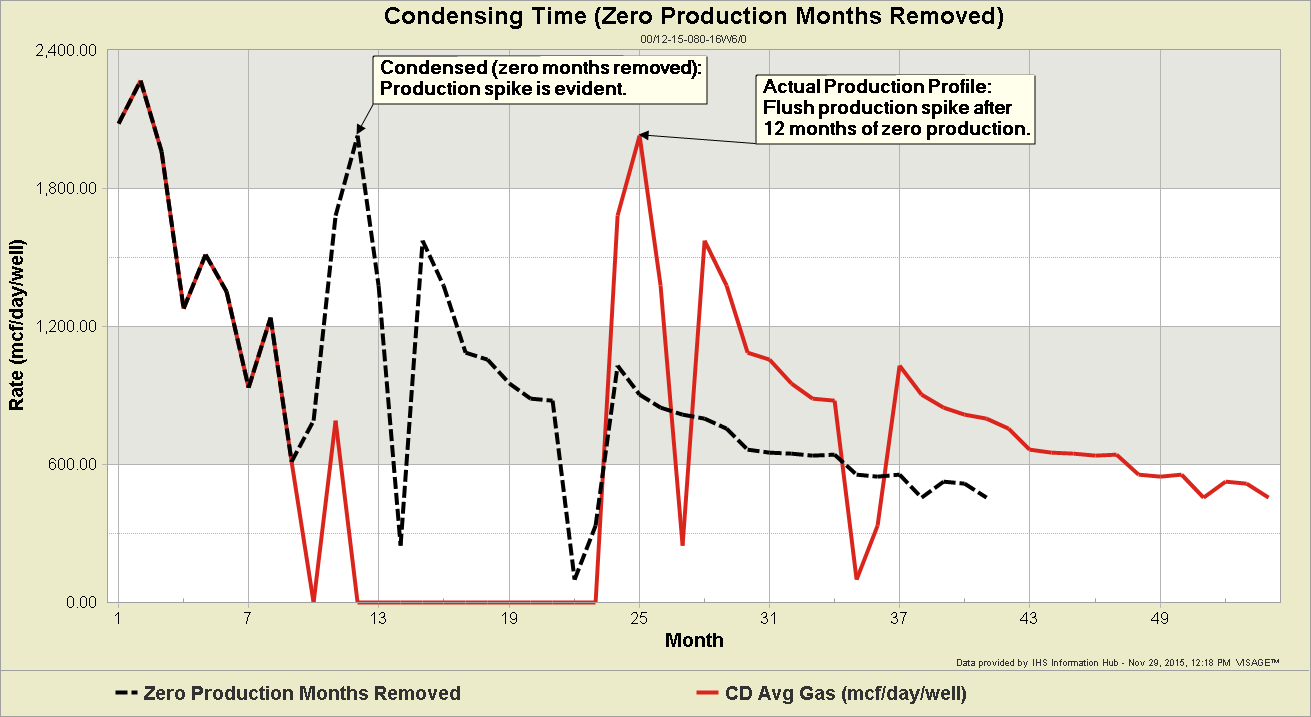
By removing time periods with no production you are aligning producing months across the data set. While this is a good practice on Rate vs Cumulative Production charts (which do not effectively communicate time anyway) it comes with some cautions on Rate vs Time charts. Long periods without production can result in flush production spikes on gas wells (see example below) or periods where the well is taking time to recover from a downtime event (e.g. in the case of a water flood).
A second approach is to remove time periods which have production rates below a specified threshold. This is attempting to only include “representative” production periods. This introduces a strong bias of what a “representative” production period is, without letting the data statistically demonstrate that for you.
Cumulative Producing Time
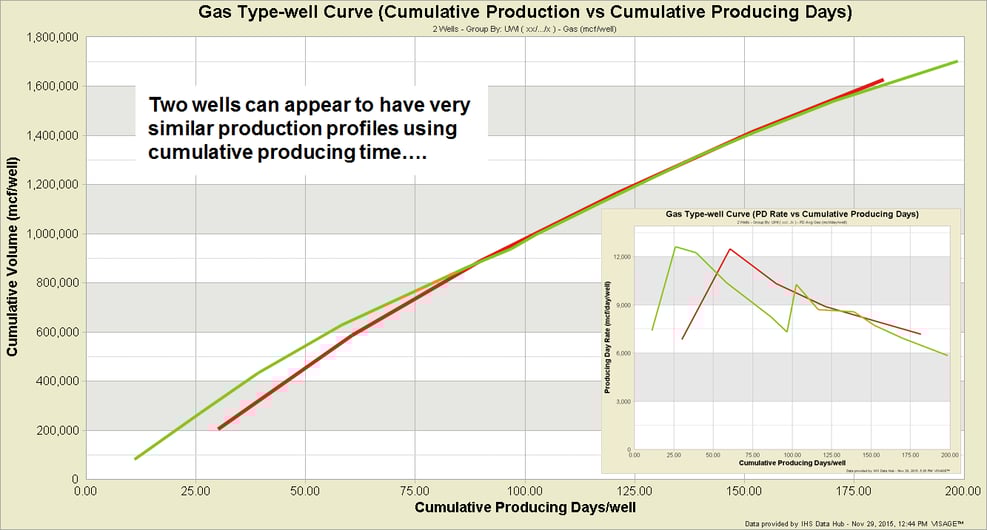
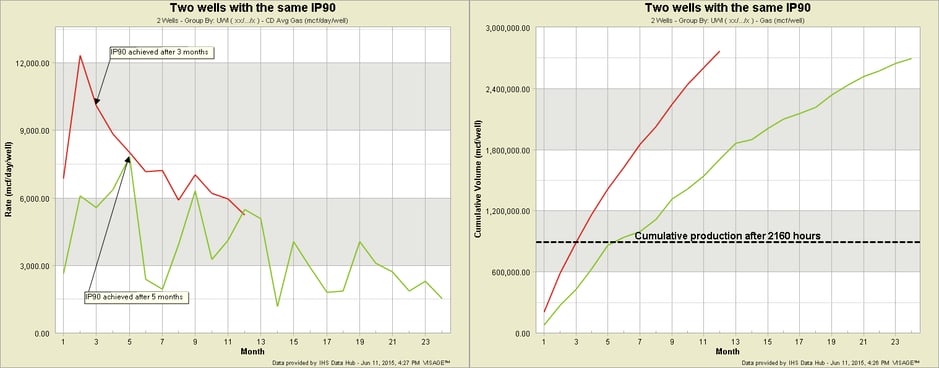
This approach essentially ignores all downtime and shows production relative to the cumulative producing hours of a well. The exclusion of downtime has the potential to portray wells as being quite similar, while in reality they demonstrate very different production performance. This is the same technique used in IP90 production measures (see the following blog for more details How useful are IP30, IP60, IP90 … initial production measures?). In the example below the first chart shows how two wells appear to have the same production profiles using condensed (producing) time, while the second chart shows how in actual elapsed time these same wells yield dramatically different results.
Important Questions Decision Makers Should Ask
Given the possible issues demonstrated in the examples above (when using Idealized Type-well Curves), it is increasingly important that decision makers ask these questions:
- How was this type-well curve developed? What does it represent?
- Is it being used to inform economic decisions or development plans?
- Yes… then has it been scaled to accurately reflect operational realities?
Next week we will discuss techniques to apply operational/downtime factors to idealized type-well curves to better reflect expected outcomes.
That concludes part 5 of this series. The remaining topics that you can look forward to include:
- Operational/Downtime Factors on Idealized Curves
- Survivor Bias
- Truncation Using Sample Size Cut-off
- Forecast the Average vs Average the Forecasts
- Representing Uncertainty
- Auto-forecast
________________________________________________________
About Bertrand Groulx
Bertrand Groulx is a well-respected oil and gas industry expert with almost 30 years of experience driving innovation and developing advanced solutions. He possesses deep knowledge and understanding of data analytics in the sector, which has allowed him to deliver unparalleled enhancements to Omnira Software's VERDAZO and MOSAIC software products. Bertrand's extensive accomplishments in the public and private sectors and his scientific publications and presentations on machine learning, visual analytics, and completion optimization have made him a thought leader. With a B.S. Honors in Geology and Geology and Geomorphology from the University of British Columbia, Bertrand focuses on enhancing Omnira Software's business intelligence and discovery analytics products in his current role, particularly the VERDAZO platform's growth and development. As a blog author, Bertrand shares his unique expertise and insights, offering valuable knowledge and guidance to industry professionals seeking to stay at the forefront of the constantly evolving oil and gas landscape.
Production data: IHS Information Hub
Analysis: VERDAZO
Some other blogs you may find of interest:
- Type Curves Part 1: Definitions and Chart Types
- Type Curves Part 2: Analogue Selection
- Type Curves Part 3: Normalization
- Type Curves Part 4: Calendar Day vs Producing Day
- What production performance measure should I use?
- Frac Analysis in VERDAZO: How to Refine Your Insights Using Distributions
About Bertrand Groulx
Bertrand Groulx is a well-respected oil and gas industry expert with almost 30 years of experience driving innovation and developing advanced solutions. He possesses deep knowledge and understanding of data analytics in the sector, which has allowed him to deliver unparalleled enhancements to Omnira Software's VERDAZO and MOSAIC software products. Bertrand's extensive accomplishments in the public and private sectors and his scientific publications and presentations on machine learning, visual analytics, and completion optimization have made him a thought leader. With a B.S. Honors in Geology and Geology and Geomorphology from the University of British Columbia, Bertrand focuses on enhancing Omnira Software's business intelligence and discovery analytics products in his current role, particularly the VERDAZO platform's growth and development. As a blog author, Bertrand shares his unique expertise and insights, offering valuable knowledge and guidance to industry professionals seeking to stay at the forefront of the constantly evolving oil and gas landscape.
