Privacy Notice: This website uses analytics and marketing cookies to understand reader behavior and improve content. By continuing to browse or engage with this site, you consent to our use of cookies. See our Privacy Policy for details.
Editor’s Note: With VERDAZO proudly joining Omnira Software in 2022, this blog is being re-published on the Omnira Software website.
Type-well Curves have many complexities and can be developed to serve a variety of purposes. As such any decision maker who is using Type-well Curves (especially Idealized Type-well Curves) as part of any decision making process should be asking:
- How was this Type-well curve developed? What does it represent?
- Is it being used to inform economic decisions or development plans?
- Yes… then has it been scaled to accurately reflect operational realities? (i.e. scaled with an Operational/Downtime Factor)
There are several approaches to calculating an Operational/Downtime Factor for your Idealized Type-well Curve. Three example approaches include:
1) Downtime Approach
This is = (Hours Producing / Hours Available). While this is an easy calculation to perform can be the least reliable. The main weaknesses are:
- This is not a “production-weighted” factor (e.g. if more downtime happens in the small producers, then you could be applying too large a factor to your large producers … and vice versa)
- The downtime percentage can vary year over year … should you apply different factors for each year? No. This would be adding complexity without increasing confidence in the result.
2) Lost Production Approach
Lost Production is an estimate of the production loss that is attributable to downtime. Whether you are using your internal proprietary data, or public data, there are effective algorithms that can help you quickly arrive at a reasonable factor. While this is more reliable that the Downtime Approach, because it is production-weighted, it does require you to have complex algorithms in place. This is better suited as a Production Performance Diagnostic tool.
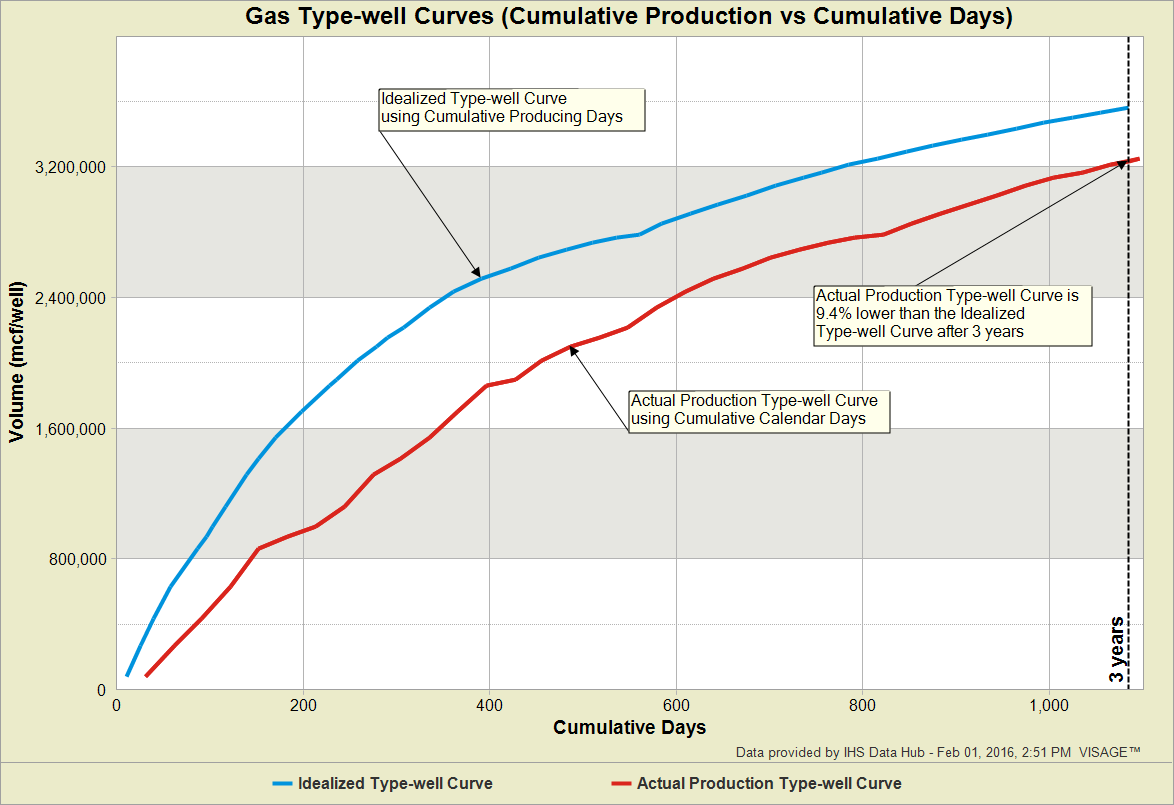
3) Cumulative Production Approach
This is the simplest and most reliable approach for determining a reasonable Operational/Downtime Factor. It involves selecting a point in time and comparing the Idealized Type-well Curve’s Cumulative Production with the Actual (Calendar Day) Production Type-well Curve’s Cumulative Production (as illustrated in the example chart below). The main strengths are:
- The ease at which this calculation can be done
- It is inherently production-weighted because it respects the actual cumulative production at a point in time (i.e. a realistic expectation of production)
The biggest challenge with this approach is determining what point in time to use. While there is no correct answer, consider this:
- Given most of the value of a typical horizontal well occurs in the first 3 to 5 years, there may be little to be gained by including more time than this. Your choice is dependent on the play and expected operational challenges.
- Too long a time frame can incorporate bias as older and surviving wells begin to dominate the Type-well curve (this will be discussed in the next blog).
Conclusion
Cumulative production is one of the easiest production-weighted approaches to use and it respects the cumulative production you can realistically expect a well to produce at a particular moment in time. The three most important things to remember when using (and adjusting) Idealized Type-well Curves for decisions:
- Calculate and apply a defendable Operational/Downtime Factor (regardless of what method you choose)
- Use a consistent approach
- Be sure to communicate to your team or decision maker how the factor was calculated
That concludes part 6 of this series. The remaining topics that you can look forward to include:
- Survivor Bias
- Truncation Using Sample Size Cut-off
- Forecast the Average vs Average the Forecasts
- Representing Uncertainty
- Auto-forecast Tools
___________________________________________________________
About Bertrand Groulx
Bertrand Groulx is a well-respected oil and gas industry expert with almost 30 years of experience driving innovation and developing advanced solutions. He possesses deep knowledge and understanding of data analytics in the sector, which has allowed him to deliver unparalleled enhancements to Omnira Software's VERDAZO and MOSAIC software products. Bertrand's extensive accomplishments in the public and private sectors and his scientific publications and presentations on machine learning, visual analytics, and completion optimization have made him a thought leader. With a B.S. Honors in Geology and Geology and Geomorphology from the University of British Columbia, Bertrand focuses on enhancing Omnira Software's business intelligence and discovery analytics products in his current role, particularly the VERDAZO platform's growth and development. As a blog author, Bertrand shares his unique expertise and insights, offering valuable knowledge and guidance to industry professionals seeking to stay at the forefront of the constantly evolving oil and gas landscape.
Production data: IHS Information Hub
Analysis: VERDAZO
Some other blogs you may find of interest:
- Type Curves Part 1: Definitions and Chart Types
- Type Curves Part 2: Analogue Selection
- Type Curves Part 3: Normalization
- Type Curves Part 4: Calendar Day vs Producing Day
- Type Curves Part 5: Condensing Time (Idealized Type Curves)
