The steep decline rates of multi-stage horizontal wells result in production being more heavily weighted towards the early life of the well. The point at which 50% of the well’s EUR is produced (i.e. the “Half-life” of the well) occurs at approximately 20% of the well’s life (in this Montney example).
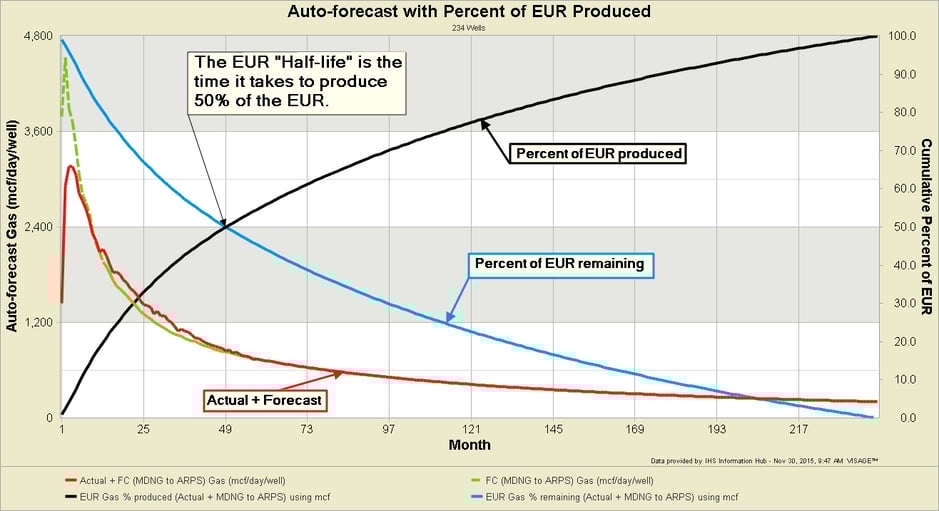
The Half-life of a well is an important measure in that it correlates strongly with the point where 80% of a well’s value has been achieved (see example chart below courtesy of Rose & Associates). That is, roughly 80% of a the well’s value will occur in the first 20% of its life. While this will vary from play to play and with well design, it does make a salient point… the bulk of the value is achieved quite quickly
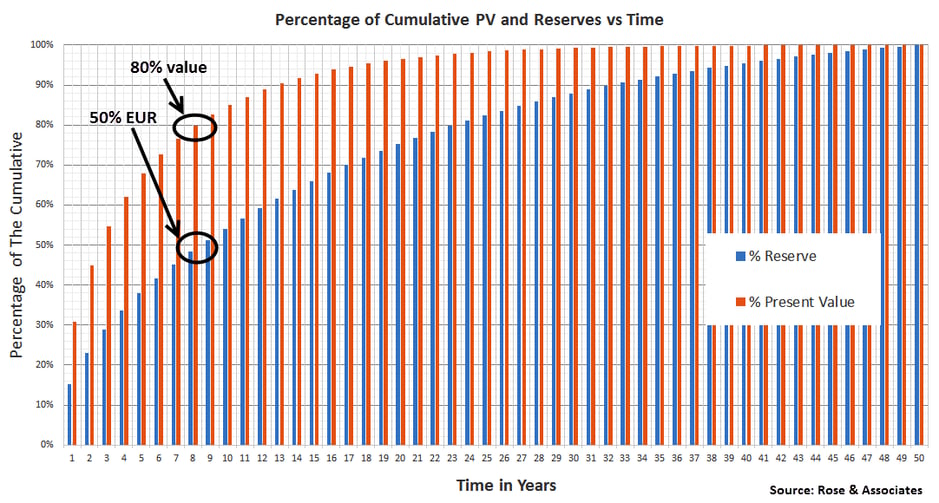
This has a variety of implications. If roughly 80% of the value occurs in the first 20% of the life of a well, then value will inherently be a bigger driver for investment decisions. It also means that the value of a well that has just come on production is dramatically impacted by near term price changes.
So why do we bother with EUR determinations? EUR is a measure of production potential that companies can leverage to borrow capital. The reality is that we will always need EUR forecasts and that only the first few years really matter from a value or payout perspective. What’s often missing from either perspective is an understanding of uncertainty, range of outcomes and the associated risk.
Uncertainty and Forecasts
The importance in characterizing uncertainty is that it allows us to answer questions like, “What is the chance that this well will payout in the first 5 years?”. A common practice when determining an EUR for a Type-well is to truncate the Type-well Curve and apply a decline profile to get a single full life profile. This approach, called “Forecasting the Average”, is time effective but does not provide any insights into the range of possible outcomes. An alternate approach is to “Average the Forecasts” of all the wells in the sample set. On large data sets this is extremely time consuming unless auto-forecasting methods are used. Auto-forecasting can offer several key benefits:
- statistical evaluation of the range of EUR outcomes including P10/P90 quantification of uncertainty
- reducing bias and fueling conversations about risk
- spatial examination of EUR outcomes in the analogue dataset
- sanity check for “Forecasting the Average” results
- dimensional normalization of EUR (exploring the impacts of completion design on EUR)
- exploring the degree to which factors like “time to boundary dominated flow” impact EUR (and value)
- etc.
While auto-forecasting lacks the professional judgement (and bias) of an engineer, and will never replace an engineer, there are ways to improve the reliability of auto-forecast results. You can use correlation measures on the fitting algorithms to exclude forecasts that do not fit the data effectively. With the remaining wells you can easily scroll through them and use your professional judgement to reject forecasts that don’t visually fit the data. This typically leaves you with a dataset large enough to leverage the benefits of auto-forecasting, as outlined above.
Statistical Uncertainty Insights
The following charts are illustrations of how auto-forecasting can provide statistical insight into uncertainty and the range of possible outcomes.
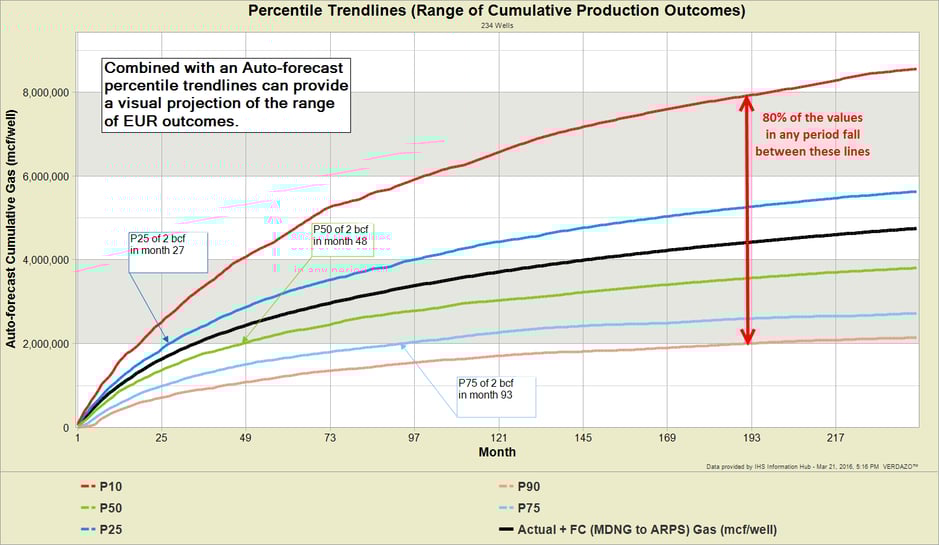
1) Payout Uncertainty: If 2 bcf cumulative production is my payout point (at a given price), I can use a chart like this to determine:
- 25% chance payout will take 27 months or less
- 50% chance payout will take 48 months or less
- 75% chance payout will take 93 months or less
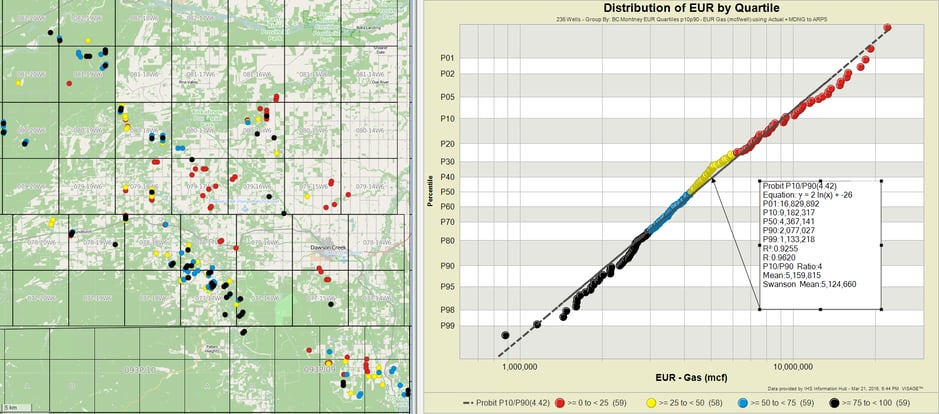
2) Distribution of EUR: using a distribution of EUR values and colouring them by quartiles, combined with a map, can provide spatial insights more readily than bubble maps would provide. The same technique can be used against dimensionally normalized EUR values (e.g. EUR/100m Completed length binned by Proppant Tonnes/100m) or other performance measures.
Informing Multi-segment Arps with Auto-forecast Insights
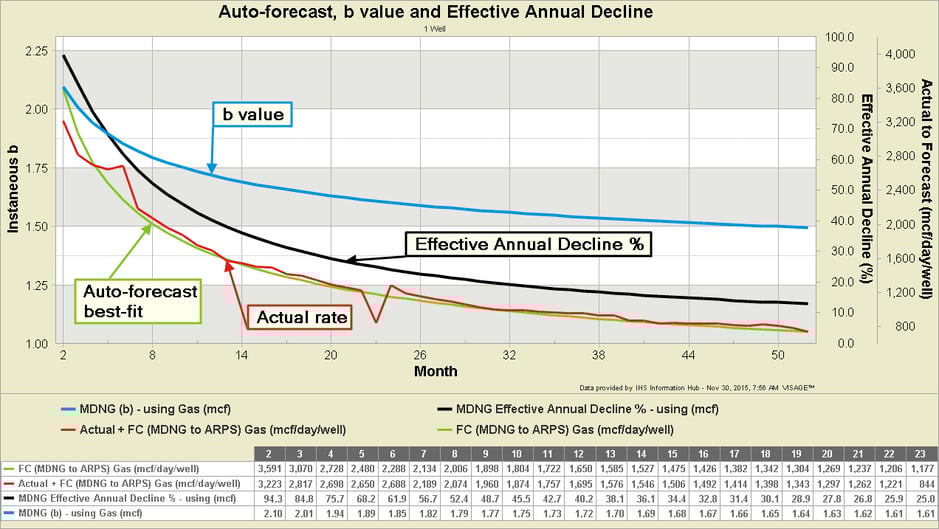
Auto-forecasts offer a collection of additional benefits that can help reduce bias and improve “Forecasting the Average” efforts that use multi-segment Arps. Because the forecast generates a smooth production profile, values such as “instantaneous b” and “effective annual decline” can be derived. The example below characterizes how b changes during the transient flow period of a well’s decline. This affords several opportunities to look at distributions of these parameters at a specific period in time and compare how quartiles vary spatially (like the previous EUR distribution).
That concludes the final installment on the series of Type-well Curves. You can download the presentation that this series was based on here… VERDAZO SPE Presentation Calgary - Understanding Type-well Curve Complexities. Thanks for reading!
___________________________________________________________
About Bertrand Groulx
Bertrand Groulx is a well-respected oil and gas industry expert with almost 30 years of experience driving innovation and developing advanced solutions. He possesses deep knowledge and understanding of data analytics in the sector, which has allowed him to deliver unparalleled enhancements to Omnira Software's VERDAZO and MOSAIC software products. Bertrand's extensive accomplishments in the public and private sectors and his scientific publications and presentations on machine learning, visual analytics, and completion optimization have made him a thought leader. With a B.S. Honors in Geology and Geology and Geomorphology from the University of British Columbia, Bertrand focuses on enhancing Omnira Software's business intelligence and discovery analytics products in his current role, particularly the VERDAZO platform's growth and development. As a blog author, Bertrand shares his unique expertise and insights, offering valuable knowledge and guidance to industry professionals seeking to stay at the forefront of the constantly evolving oil and gas landscape.
Production data: IHS Information Hub
Analysis: VISAGE
Some other blogs you may find of interest:
- Type Curves Part 1: Definitions and Chart Types
- Type Curves Part 2: Analogue Selection
- Type Curves Part 3: Normalization
- Type Curves Part 4: Calendar Day vs Producing Day
- Type Curves Part 5: Condensing Time (Idealized Type Curves)
- Type Curves Part 6: Operational/Downtime Factors on Idealized Curves
- Type Curves Part 7: Survivor Bias
